It’s been a strong year thus far for the convertible bond market, with the benchmark ICE BofA U.S. Convertible Index returning 9.6% year to date through July 31.  And in a period marked by volatility amid concerns over the impact of U.S. trade policy, the convertible market has indeed offered attractive risk-adjusted returns based on the Sharpe ratio of the ICE BofA index relative to broader equity indexes. The market displayed its historical resilience, providing limited downside when markets sold off through early April, while offering significant upside participation during the subsequent market rally into June.

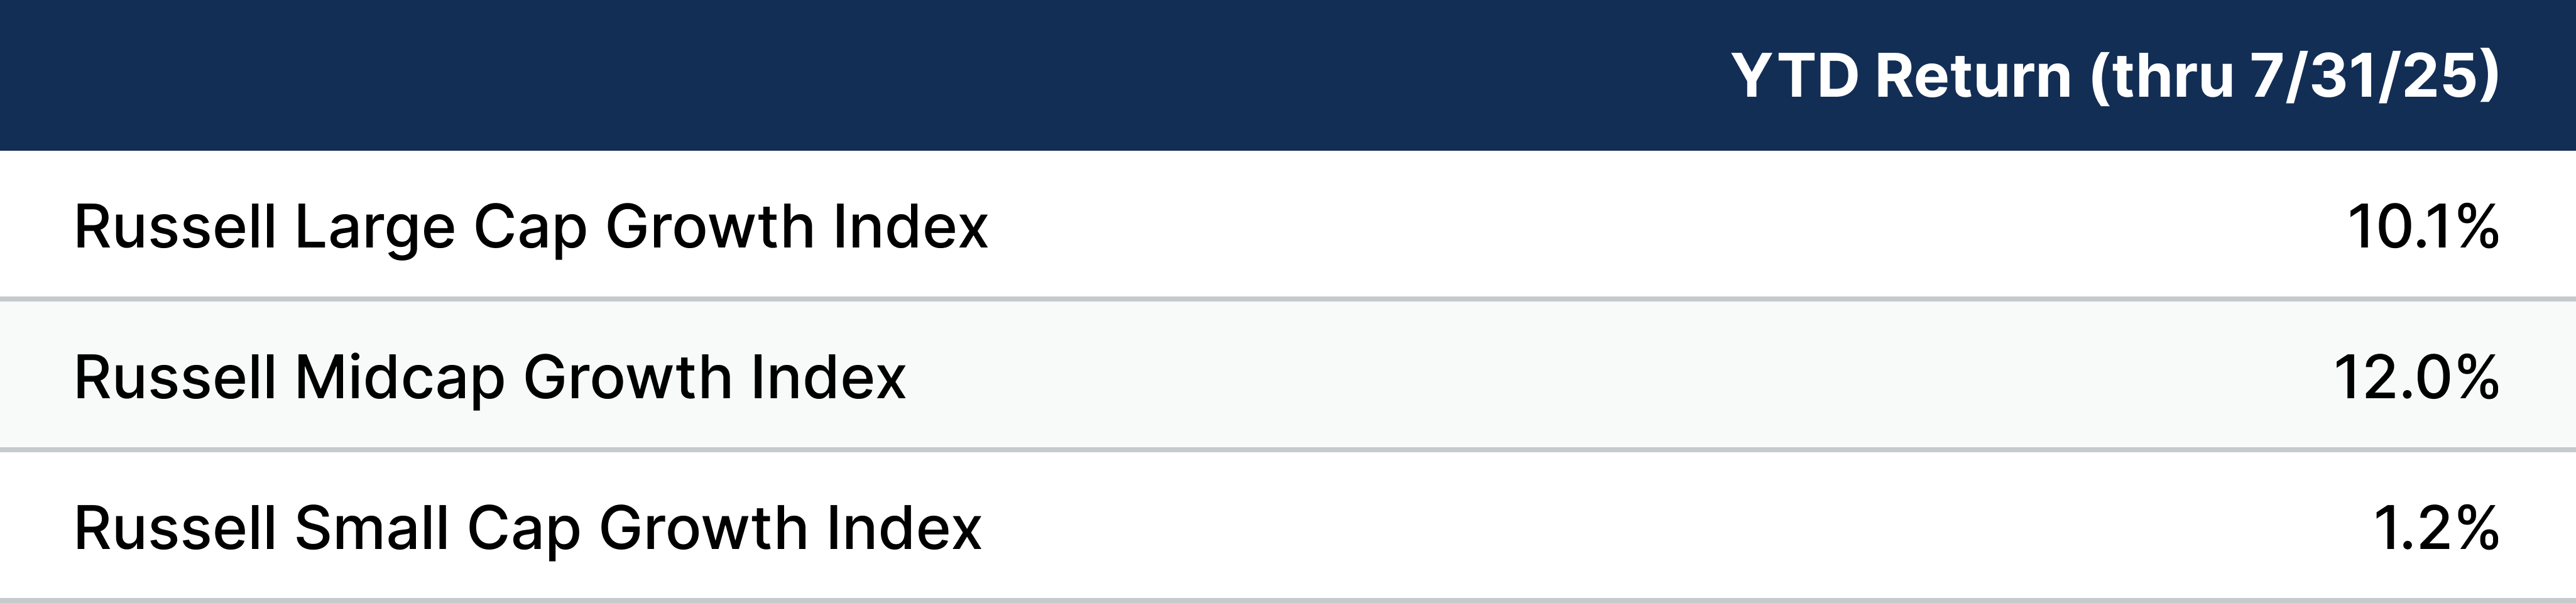
One major driver of convertible returns has been the strength in mid cap growth equities, where returns have been better than both their large- and small-cap growth equity counterparts (see Figure 1). Historically, convertible returns are most highly correlated to mid-cap growth equities.

Figure 1.  First-Half Strength in Mid-Cap Growth Equities Carries Favorable Implications for Convertible Bonds

Year-to-date index returns (ended July 31)

Chart SHowing Year-to-date index returns (ended July 31)
Source: Morningstar. Data as of July 31, 2025. Russell Large Cap Growth Index = Russell 1000® Growth Index. Russell Small Cap Growth Index = Russell 2000® Growth Index.  For illustrative purposes only and does not represent any specific portfolio managed by Lord Abbett or any particular investment. Past performance is not a reliable indicator or guarantee of future results.

What is the outlook for convertible bonds for the rest of 2025?

The market was able to weather the volatility of the first half. But what’s ahead? Our outlook for the convertible market through the rest of the year remains quite favorable. 

Due to the strong year-to-date returns, the convertible market’s delta (a measure of the sensitivity of the price of a convertible bond to changes in the price of the underlying stock) is now in the mid-50s, up from the high 40s earlier in the year. 

Figure 2. Convertible Market’s Delta Has Risen, But Remains Below Highs of Recent Years

Data for the period 06/30/2009 – 06/30/2025

Line Chart showing that the Convertible Market’s Delta Has Risen, But Remains Below Highs of Recent Years
Source: Bloomberg. Data as of June 30, 2025. Delta refers to the sensitivity of the price of a convertible bond to changes in the price of the underlying stock; the lower the delta, the lower the sensitivity.
For illustrative purposes only and does not represent any specific portfolio managed by Lord Abbett. Indexes are unmanaged, do not reflect the deduction of fees or expenses, and are not available for direct investment.
Past performance is not a reliable indicator or guarantee of future results.

While the convertible market has a higher level of equity sensitivity compared to recent history, this is still well below where the market delta has generally traded over the past 10 years. At these levels, an investor still has the potential to garner highly attractive risk-adjusted returns relative to history. 

What are the key signals for convertibles for the second half of the year?

The convertible market is just now eclipsing its prior peak seen in November 2021, as compared with other major equity indices that are trading well above their prior peak. This suggests that the market recovery for convertibles may be in its early stages.

Figure 3. A Quick Comparison of Equity Benchmarks Suggests Convertibles’ Recovery May Have More Room to Run

Index data as of July 31, 2025

Chart showing Benchmarks % above market peak
Source: Bloomberg. Data as of July 28, 2025.
For illustrative purposes only and does not represent any specific portfolio managed by Lord Abbett. Indexes are unmanaged, do not reflect the deduction of fees or expenses, and are not available for direct investment.
Past performance is not a reliable indicator or guarantee of future results.

And with a market delta in the mid-50s, as mentioned earlier, history would also suggest strongly positive forward returns over a 3-year period: 

Figure 4. Low-Delta Periods for Convertibles Have Historically Been Followed by Strong Returns

Average three-year forward cumulative total returns for the Bloomberg U.S. Convertible Bond Index by delta range, as of June 30, 2025

Bar Chart Showing Average three-year forward cumulative total returns for the Bloomberg U.S. Convertible Bond Index by delta range, as of June 30, 2025
Source: Bloomberg. Data as of June 30, 2025. Delta refers to the sensitivity of the price of a convertible bond to changes in the price of the underlying stock; the lower the delta, the lower the sensitivity.
For illustrative purposes only and does not represent any specific portfolio managed by Lord Abbett. Indexes are unmanaged, do not reflect the deduction of fees or expenses, and are not available for direct investment.
Past performance is not a reliable indicator or guarantee of future results.

What are the key takeaways for convertible bond investors?

The convertible market’s strong returns so far this year are a good reminder of the asset class’s ability to deliver compelling risk-adjusted returns in a volatile environment. We believe there is still additional upside in convertibles going forward as the market recovery continues. 

To take advantage in this current market environment, we believe that a flexible, opportunistic approach is most appropriate. Lord Abbett has been managing convertible securities for over five decades (dating back to 1971) as a component of our multi-sector strategies.  The depth of our analytical and security valuation resources across innovation equity, as well as credit research, empowers the team to utilize an unbiased approach that can capture opportunities across the credit and delta spectrum, which we believe is crucial as it offers the potential to drive alpha in today’s market.