From California to New York, the nation's largest state and local issuers face different economic opportunities and challenges. Below, we examine the fiscal conditions, budget trends, and credit fundamentals of California, Florida, Illinois, Chicago, Massachusetts, New Jersey, New York, New York City, and Texas.
Municipal bonds continue to offer attractive after-tax income opportunities, while credit fundamentals across much of the market remain solid. As investors evaluate municipal bond allocations, the fiscal health of U.S. states and local governments remains an important consideration.
We examine the fiscal standing of several of the largest state and local municipal bond issuers and offer observations about the implications for investors.
U.S. State Budgets: Fiscal Management Remains Sound
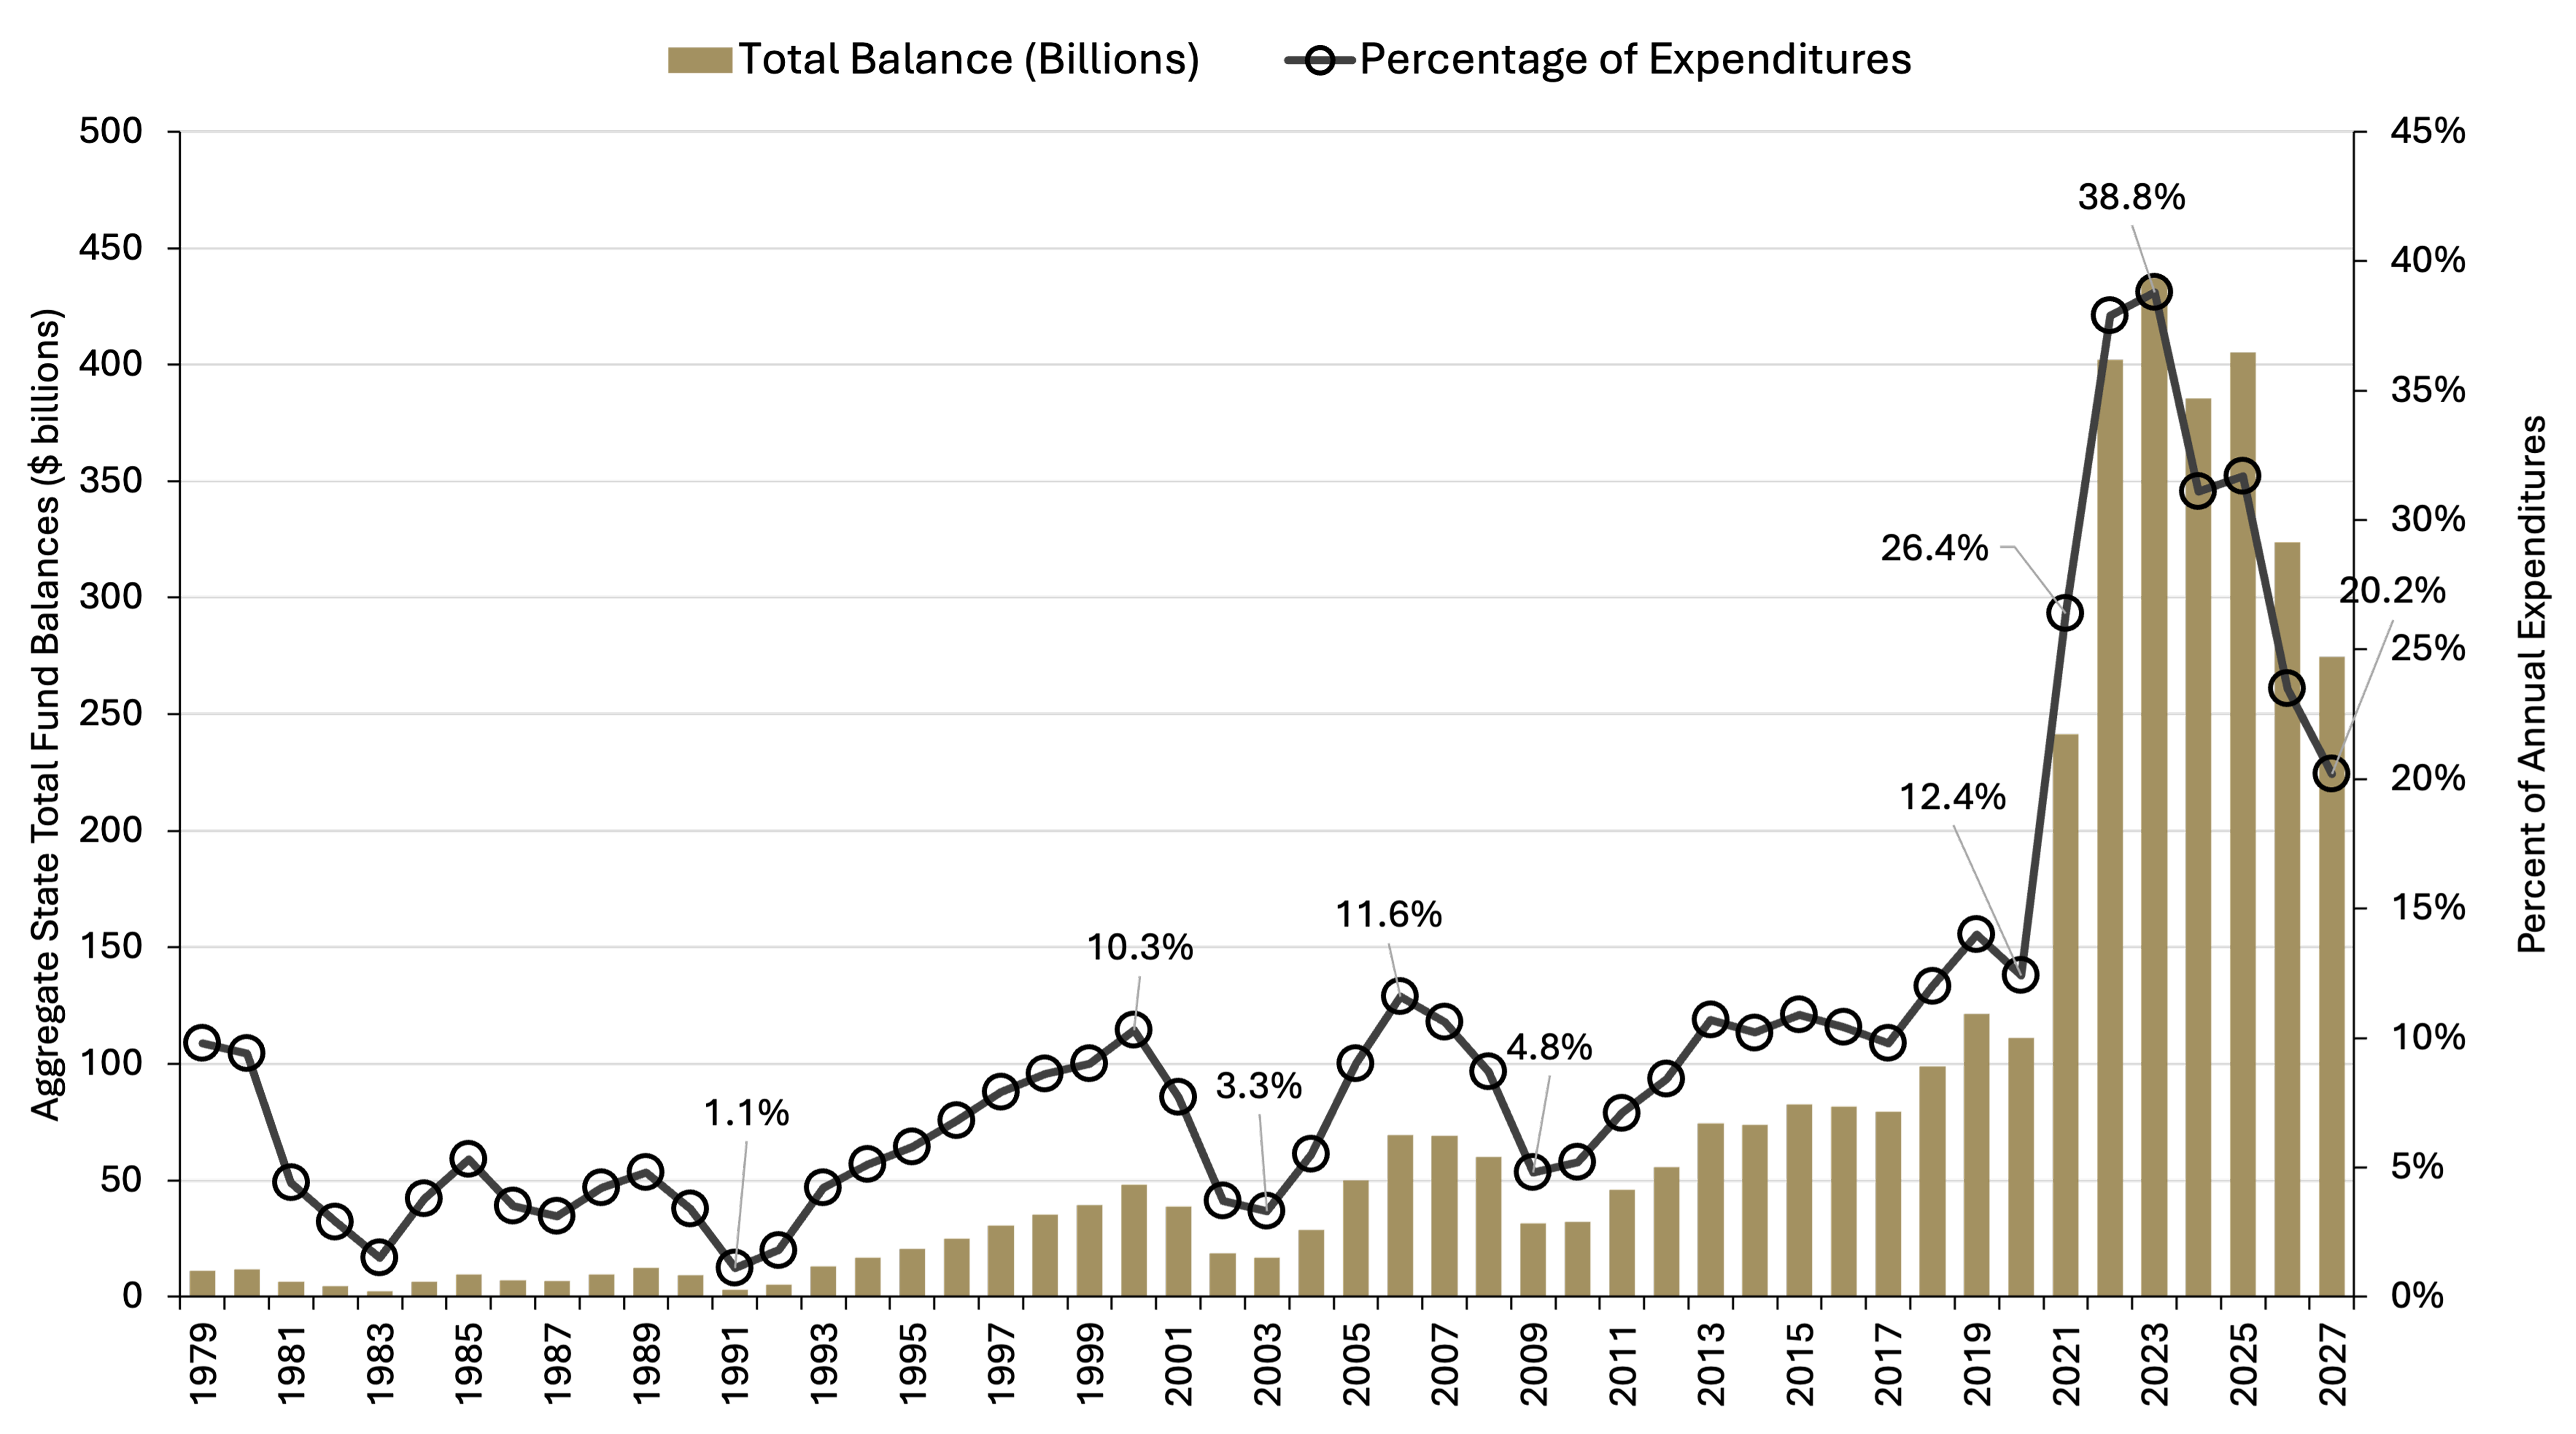
State reserve balances continue to normalize from the unusually high levels reached during the COVID-19 pandemic but remain exceptionally strong by historical standards. States are estimated to end fiscal year 2026 with reserves equal to 23.5% of annual expenditures, declining to a projected 20.2% by the end of fiscal year 2027 (see Figure 1). Even after this normalization, reserve levels are expected to remain more than twice the long-term average of 10.0%, providing states with a meaningful fiscal cushion.
Figure 1. State Reserve Balances Remain Elevated Compared to History
Aggregate state total fund balance ($billions) and percent of annual expenditures, 1979–2027 (estimated)
Source: National Association for State Budget Officers (NASBO) Spring 2026 Fiscal Survey of States, May 2026. For illustrative purposes only.
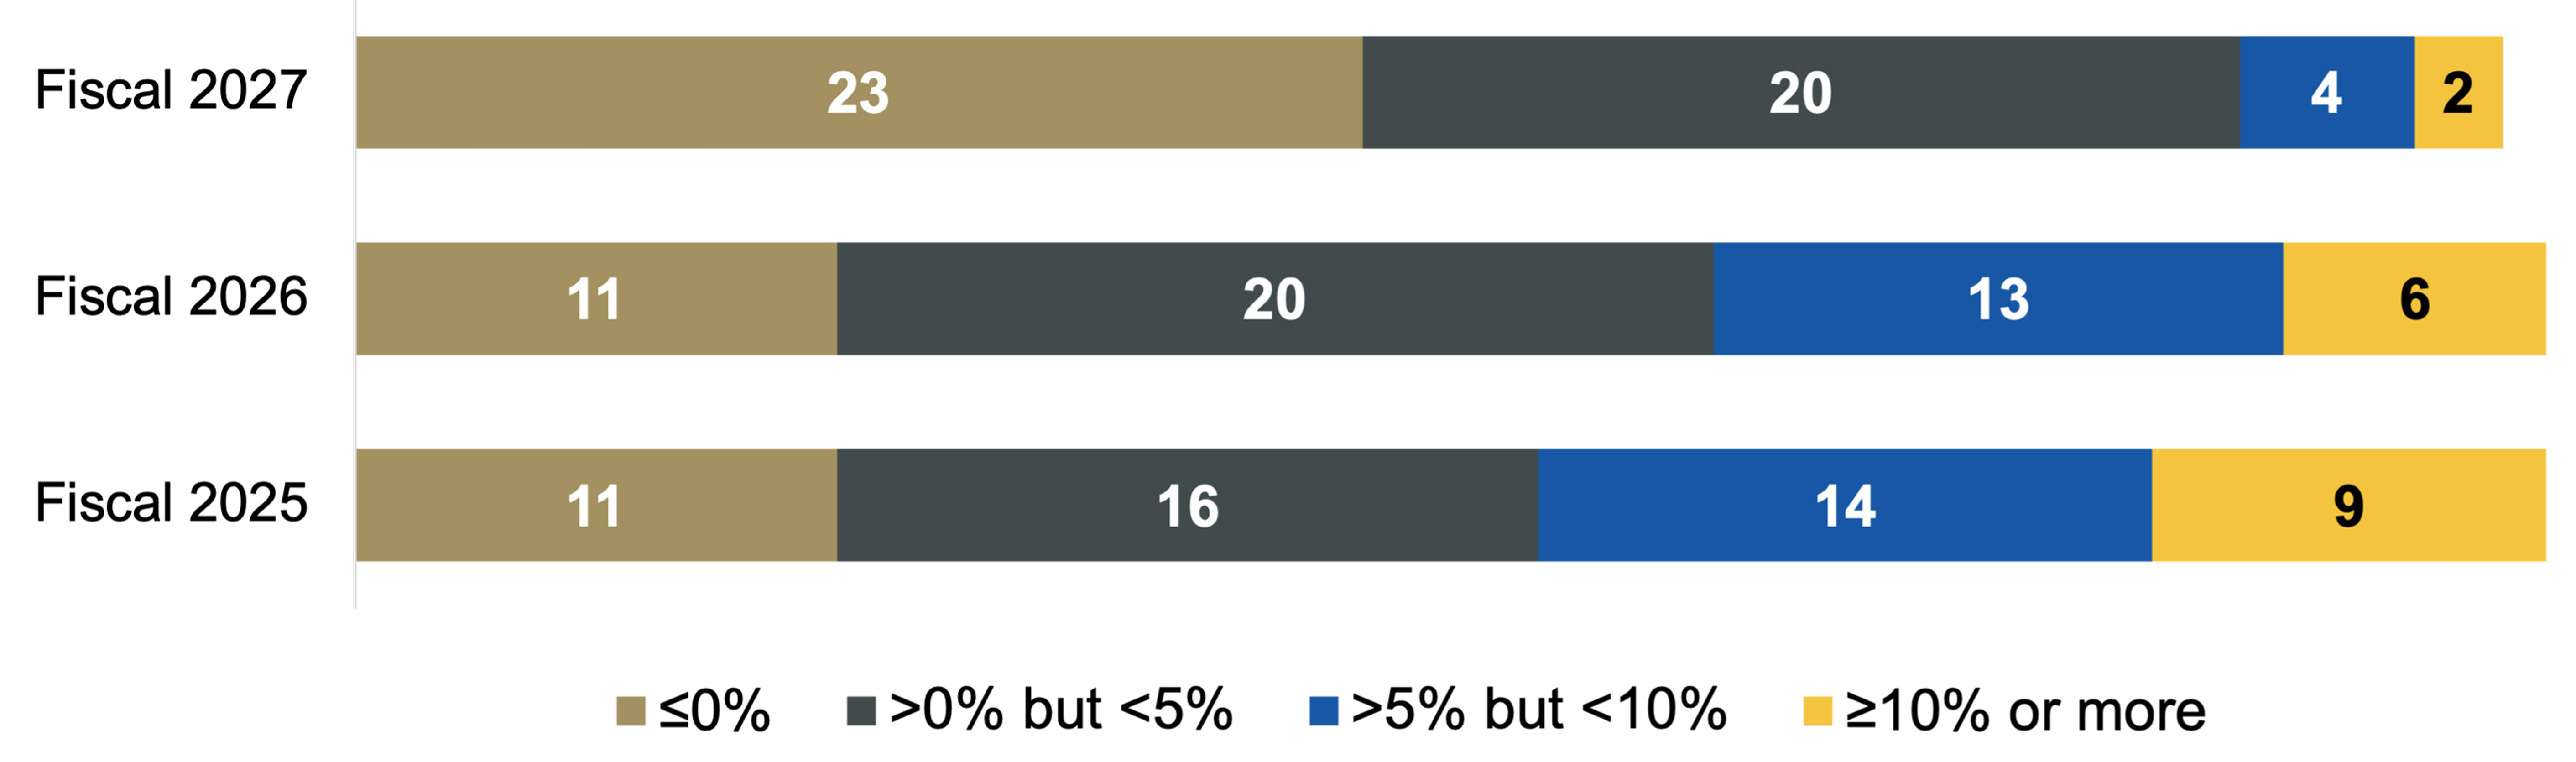
State spending is also returning to more typical levels after the abnormal growth experienced during the pandemic. Aggregate general fund spending is budgeted to decline 1.4% in fiscal year 2027 compared with fiscal year 2026—the first year-over-year decline since 2010—with nearly half of states planning to spend less than they did the previous fiscal year (see Figure 2). Importantly, many states are addressing slower revenue growth through structural budget adjustments, including targeted spending reductions and revenue measures, rather than relying heavily on rainy day funds. This reflects a more measured approach to managing budgets as fiscal conditions normalize.
Figure 2. Spending Growth Rate Declines as More States Reduce Expenditures
Annual growth rate (nominal) of aggregate state spending, 2000–2027 (top panel) and number of states planning to reduce spending by percentage range shown (bottom panel)

Source: National Association for State Budget Officers (NASBO) Spring 2026 Fiscal Survey of States, May 2026. For illustrative purposes only.
Our View on California: Reserves remain strong and targeted spending cuts continue to keep expense growth manageable.
California continues to meaningfully outperform projections. The state collected $153 billion in personal income tax revenue in the fiscal year ending June 30, 2026, an amount that is 18%, ($23.25 billion) above budget and 21% ($26.6 billion) above fiscal year 2025 collections. The state’s war chest remains close to the historic highs seen during the COVID-19 pandemic, with the 2026-27 budget showing $68.7 billion in total reserves heading into fiscal year 2027, more than $12 billion above the level seen this time last year. The state is projecting a modest 2.5% expenditure growth, achieved through targeted cuts, particularly to Medi-Cal (California's Medicaid program), that will continue to compound savings in out-years, while still increasing K-12 funding, which will also benefit school district credits in the state.1
Figure 3. Revenue and Reserve Balances Have Increased as Ratings Remain Stable
Fiscal year total revenues (cash basis), personal income tax receipts, reserve balances, and credit quality ratings

Source: State of California Statement of General Fund Cash Receipts and Disbursements, June 2026, and State of California Budget 2025-2026 Summary Charts. Data as of June 30, 2026. Ratings data as of December 31, 2026, and December 31, 2016. FY=fiscal year. California’s fiscal year ends on June 30. Fiscal year data refers to the 12 months of fiscal year 2026 (July 1, 2025, through June 30, 2026) and fiscal year 2025 (July 1, 2024, through June 30, 2025). For illustrative purposes only.
Our View on Florida: The state has continued to increase reserves while cutting expenditures to shore up its financial position.
Florida recently passed its fiscal year 2026-2027 budget, which totaled $117.6 billion. This budget marked the fourth consecutive year of spending decreases, which included a mix of headcount reductions, cost efficiencies, and other initiatives. The budget also included a transfer of $118 million to the Budget Stabilization Fund, also known as rainy day fund, and $500 million to the Emergency Preparedness and Response Fund. The state has maximized its rainy day fund to its constitutional limit of $5 billion, up from its initial balance of $1.5 billion in 2019. Total reserves have grown to more than $12.4 billion as of the fiscal year 2026 estimates. While the state has continued to boost and shore up its finances, local governments including cities and counties may see some financial weakening in the near future, as a proposed constitutional amendment to increase the homestead property tax exemption will be decided by voters in November 2026. If passed, legislative analysts project ~$5 billion of lost revenue in fiscal year 2027-28, which is expected to eventually grow to ~$12 billion by fiscal year 2031-32.
Figure 4. Positive Revenue and Reserve Trends with Attractive Ratings
Figure 4. Positive Revenue and Reserve Trends with Attractive Ratings

Source: Florida Annual General Revenue Receipts by Source, June 30, 2026, and The Florida Legislature Fiscal Analysis in Brief for Fiscal Year 2025-2026. Ratings data as of December 31, 2026, and December 31, 2016. Florida’s fiscal year ends on June 30. Fiscal year data refers to the 12 months of fiscal year 2026 (July 1, 2025, through June 30, 2026) and fiscal year 2025 (July 1, 2024, through June 30, 2025). For illustrative purposes only.
Our View on Illinois: We are closely monitoring signs of slower revenue and reserve growth after recent outperformance, but the state remains focused on keeping its financials balanced.
Illinois reported a record-high $56.3 billion in revenue in fiscal year 2026, beating budget by about $1 billion. The state’s present strength is a reflection and continuation of the positive trends that have garnered nine collective upgrades from Moody’s, S&P, and Fitch over the last six years. However, slowing tax revenue growth and cutbacks from federal aid and reimbursement will likely dampen overall revenue and spending growth in the near term. The enacted fiscal year 2027 budget follows a similar path as recent budgets under Governor Pritzker’s administration— modest spending increases with conservative revenue estimates (that have seen a pattern of outperformance later in the year). The state has also continued to make progress on pensions, with $10.7 billion allocated in its fiscal year 2027 budget, and the aggregate funded ratio has improved to 47.4% which has been important to its improved ratings. However, despite higher contributions, pension funding remains short of actuarial determined amounts, and pensions remain a credit challenge with a net pension liability of $150 billion.
Figure 5. Positive Revenue and Reserve Trends and Constructive Ratings
Fiscal year total revenues, reserve balances, and credit quality ratings

Source: State of Illinois Investor Presentation, March 13, 2026, and Commission on Government Forecasting and Accountability Monthly Briefing, June 30, 2026. Ratings data as of December 31, 2026, and December 31, 2016. Illinois’ fiscal year ends on June 30. Fiscal year data refers to the 12 months of fiscal year 2026 (July 1, 2025, through June 30, 2026) and fiscal year 2025 (July 1, 2024, through June 30, 2025). For illustrative purposes only.
Our View on Chicago: The city is grappling with slow revenue growth while expenditures and fixed cost liabilities continue to pressure budgets and financials.
In Chicago, the city continues to face fiscal and governance challenges that will likely recur without structural reform. The fiscal year 2026 budget process revealed conflict and breakdowns of information between the mayor’s office and city council, and the $1.1 billion budget deficit was closed with significant reliance on one-time measures. The city is further hampered by delayed property tax revenue distributions from Cook County this year, which has led to cascading payment delays. S&P and Fitch both maintain a negative outlook for the city (General Obligation). Despite the challenges, Chicago remains an economic powerhouse and the third largest U.S. city by population and gross economic output. Further, the Chicago Financial Future Task Force has put together a list of structural recommendations across revenue, expenditure, economic development, and pension/liability management, and we believe many of these policies, with political will and cooperation from local and/or state leaders, can be adopted in the near term.
Figure 6. Revenue Trends, Reserves, and Ratings Bear Watching
Fiscal year total revenues, reserve balances, and credit quality ratings

Source: City of Chicago Annual Comprehensive Financial Report December 31, 2025, and City of Chicago 2026 Budget Overview. Ratings data as of December 31, 2026, and December 31, 2016. Chicago’s fiscal year ends on December 31 (calendar year). Fiscal year data refers to the 12 months of fiscal year 2025 (January 1, 2025, through December 31, 2025) and fiscal year 2024 (January 1, 2024, through December 31, 2025). For illustrative purposes only.
Our View on Massachusetts: The commonwealth remains committed to maintaining reserves while investing in the state’s education system, infrastructure, and economy.
Massachusetts has been able to consistently maintain its rainy day fund—a reserve account that state governments set aside during periods of strong economic growth to help balance budgets during economic downturns or unexpected fiscal emergencies—at around $8.1 billion (13% of own-source spending) and is expected to continue to do so in fiscal year 2027. One of the key contributors to the commonwealth’s fiscal stability has been the Fair Share Tax, colloquially referred to as the “millionaire tax,” which has consistently outperformed the conservative budgeting projections, returning an estimated $3.4 billion in fiscal year 2026 versus a budgeted $1.2 billion. This allowed for additional supplemental funding for education and transportation purposes, particularly for the Massachusetts Bay Transportation Authority (MBTA). These investments, along with others in local governments, research, and life sciences, are aimed at boosting growth and addressing affordability to maintain the commonwealth’s competitive position.
Figure 7. Positive Revenue Trends, Stable Reserves, and Attractive Ratings
Fiscal year total revenues, reserve balances, and credit quality ratings

Source: Commonwealth of Massachusetts Office of the Comptroller Financial Transparency portal (CTHRU) and Massachusetts DOR Blue Book Report. Data as of May 31, 2026. Ratings data as of December 31, 2026, and December 31, 2016. FY=fiscal year. Massachusetts’ fiscal year ends on June 30. Fiscal year data refers to the first 11 months of fiscal year 2026 (July 1, 2025, through June 30, 2026) and fiscal year 2025 (July 1, 2024, through June 30, 2025). For illustrative purposes only.
Our View on New Jersey: The state maintains solid fiscal governance in spite of modest budget deficits.
New Jersey has maintained its solid fiscal position as it enters fiscal year 2027, starting with reserves of $7.7 billion (13% of own-source spending). While the state once again plans to draw on reserves, we believe it will be a manageable amount relative to current levels. The new governor made it a goal to be more fiscally prudent, shying away from large spending initiatives, and instead opting for smaller policy goals that would not have a material impact on cost. We believe the state’s commitment to future financial stability is made clear by its spending priorities: reducing debt, making pension contributions, providing tax relief, and reducing expenditure growth.
Figure 8. Solid Revenue Trends, Manageable Reserves, and Constructive Ratings
Fiscal year total revenues, reserve balances, and credit quality ratings

Source: State of New Jersey Report Card, State of New Jersey 222nd Legislature (state reserves enacted budget), and State of New Jersey Department of the Treasury May 2026 Revenue Release. Data as of May 31, 2026. Ratings data as of December 31, 2026, and December 31, 2016. FY=fiscal year. New Jersey’s fiscal year ends on June 30. Fiscal year data refers to the first 11 months of fiscal year 2026 (July 1, 2025, through May 31, 2026) and fiscal year 2025 (July 1, 2024, through May 31, 2025). For illustrative purposes only.
Our View on New York: The state maintains ample reserves to contend with current cost pressure and spending initiatives.
New York has remained on a strong financial footing even as its budgets have continued to grow. The state started fiscal year 2027 with $34.8 billion in reserves, down from the prior year but still very strong at 23% of own-source spending—government spending that is financed by revenues the state raises itself. This has allowed the state to increase support for municipalities and the Metropolitan Transit Authority (MTA), provide energy rebate checks to residents, and offset some declines in federal Medicaid funding. Revenues have been robust to start the year, up 11%, fiscal year to date from the prior fiscal year. We expect the state’s financial position to remain firm, but we will continue to monitor spending in future years. Additionally, we will be watching how the relationship evolves between the state and New York City, which we believe is currently productive.
Figure 9. Solid Revenue Trends, Elevated Reserves, and Attractive Ratings
Fiscal year total revenues, reserve balances, and credit quality ratings

Source: New York State Division of the Budget Enacted Budget Financial Plan (reserve balances) and New York State Department of Taxation and Finance Monthly Tax Collection Report. Data as of June 30, 2026. Ratings data as of December 31, 2026, and December 31, 2016. FY=fiscal year. New York’s fiscal year ends on March 31. Fiscal year data refers to the first three months of fiscal year 2026 (April 1, 2026, through June 30, 2026) and fiscal year 2025 (April 1, 2025, through June 30, 2025). For illustrative purposes only.
Our View on New York City: The city benefits from a healthy economy and tax base but will be pressured in the medium term by high spending and out-year budget deficits.
New York City entered 2026 with a new mayor and a $12.5 billion projected budget deficit across two fiscal years. This was driven by growing expenses that the new administration decided to explicitly address. Over the course of the budget process, the New York City government managed to close the gap with a mix of higher-than-expected tax revenues, state support, targeted savings, a new pied-à-terre tax—a proposed tax on non-primary residences— and pension deferrals. The city has a well-funded pension plan and still intends to make required contributions, which separates it from what we have seen in more distressed municipalities that have poorly funded pensions and outright reduced pension contributions to zero in times of stress. We recognize that, while not structurally balanced, the budget may provide the city additional time to implement further cost savings over the year. We believe that the city’s overall economy and tax base are healthy; its challenge is one of spending, not revenue; and its ability to manage growing costs will be a key credit driver going forward.
Figure 10. Solid Revenue Trends, Stable Reserves, and Attractive Ratings
Fiscal year total revenues, reserve balances, and credit quality ratings

Source: New York City Comptroller Comments on New York City Executive Budget (reserve balances) and New York City Comptroller State Tax Collections. Data as of April 30, 2026. FY=fiscal year. New York City’s fiscal year ends on June 30. Ratings data as of December 31, 2026, and December 31, 2016. Fiscal year data refers to the first 10 months of fiscal year 2026 (July 1, 2025, through April 30, 2026) and fiscal year 2025 (July 1, 2024, through April 30, 2025). For illustrative purposes only.
Our View on Texas: The state remains a solid credit with strong reserves, resilient revenue growth, and fiscal capacity to absorb property tax relief.
Texas has remained financially strong in the 2026–27 biennium, supported by a large and diversified economy, continued population growth, and conservative fiscal management. The state relies heavily on sales and energy-related taxes, so revenues can be exposed to volatility tied to oil and gas markets, but the Economic Stabilization Fund (rainy day fund) remains a major credit strength and was projected at roughly $27 billion for fiscal year 2026, near its constitutional cap, providing ample flexibility during downturns. Recent budgets have emphasized property tax relief, including a larger homestead exemption and compression of school district maintenance and operations tax rates, which has shifted a greater share of school finance responsibility to the state. However, Texas’ strong revenue base and ample reserves have allowed it to absorb much of the cost of this relief while keeping school district credits generally stable, supported by continued state aid and ability to raise local revenue. For fiscal year 2026 through June, Texas total net revenues increased 4.2% year-over-year to $155.5 billion, while total tax collections rose 4.1% year-over-year to $72.4 billion. Sales tax collections, the state's largest revenue source, grew 6.1% year-over-year to $43.0 billion.
Figure 11. Strong Revenue Trends, High Reserve Balances, and Attractive Ratings
Fiscal year total revenues, reserve balances, and credit quality ratings

Source: Texas Comptroller Biennial Revenue Estimate Economic Stabilization Fund Ending Balances (reserve balances), Texas Comptroller Biennial Revenue Estimate, and Texas Comptroller Monthly State Revenue Watch. Data as of June 30, 2026. Ratings data as of December 31, 2026, and December 31, 2016. FY=fiscal year. Texas' fiscal year ends on August 31. Fiscal year data refers to the first 10 months of fiscal year 2026 (September 1, 2025, through June 30, 2026). For illustrative purposes only.
Summing Up
State budgets continue to normalize following the extraordinary fiscal conditions of the COVID-19 pandemic, and the overall credit picture remains strong. Elevated reserve balances, more disciplined spending, and a willingness among many states to make structural budget adjustments have helped support fiscal stability even as revenue growth has normalized. At the same time, differences among issuers remain meaningful. While some states and cities continue to strengthen their financial positions, others face longer-term challenges related to spending pressures, governance, or pension obligations. For municipal bond investors, these differences reinforce the importance of disciplined credit analysis and active issuer selection when evaluating opportunities across the municipal market.