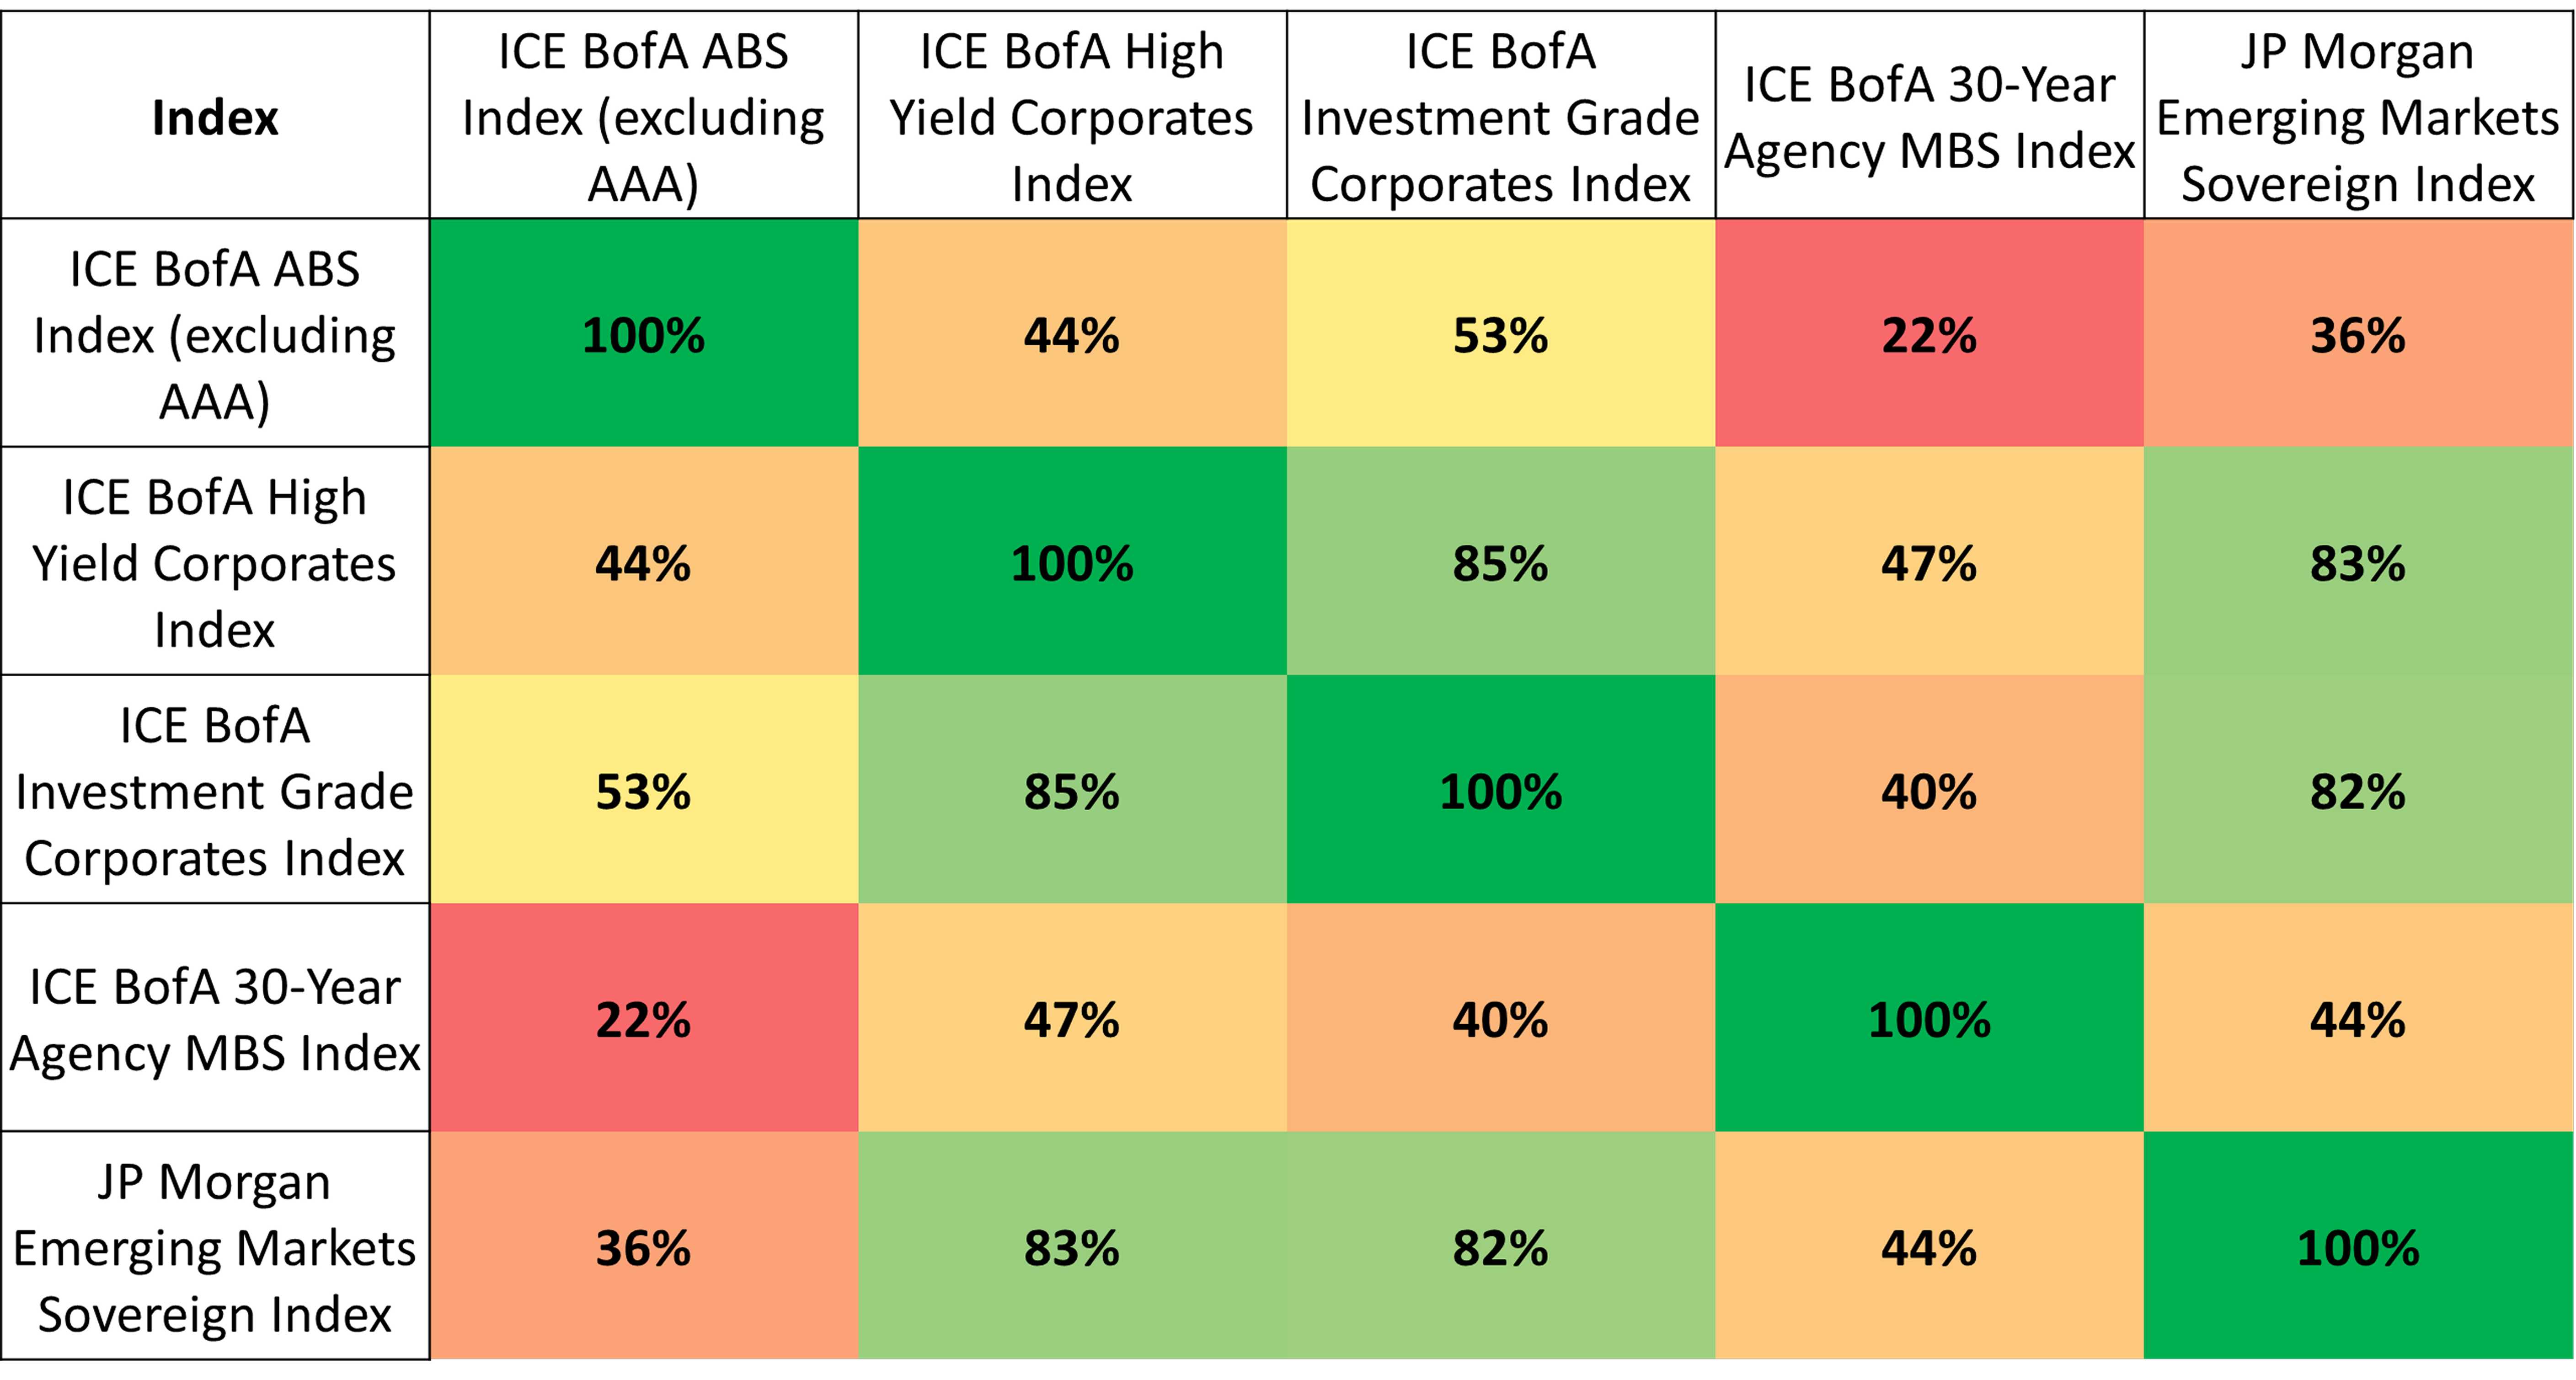
Last October, we wrote about the potential benefits of a multi-sector approach in core bonds. We focused on the risk-and-return merits of investment-grade securitized credit when compared to investment-grade corporate bonds and agency mortgage-backed securities (MBS), the two primary sources of spread risk in the Bloomberg U.S. Aggregate Bond Index (Aggregate Index).

In this commentary, we take a similar approach to highlight persistent risk-adjusted return advantages available in the high yield bond sector and expand upon the potential benefits of a disciplined multi-sector approach to drive results in the core plus bond category.

Short Duration Anomaly in High Yield Bonds

The high yield sector and its historically larger spread compensation is a natural area of focus for core plus investors. This spread compensation can be divided into a few components: a default risk premium, a liquidity risk premium (compensation for the illiquidity of the bond or issuer, as well as the mark-to-market risk from relatively higher spread volatility), and finally a term premium to compensate for increasing duration risk.

With below-investment-grade ratings, the uncertainty around the appropriate compensation for those premiums is much greater, and the high yield sector represents a true opportunity to gain competitive advantage through the strength of fundamental research, in our view. Skillful credit research analysts can identify contrarian views and idiosyncratic risks among issuers in this space and correctly value the mispricing of premiums to drive relative outperformance through security selection.

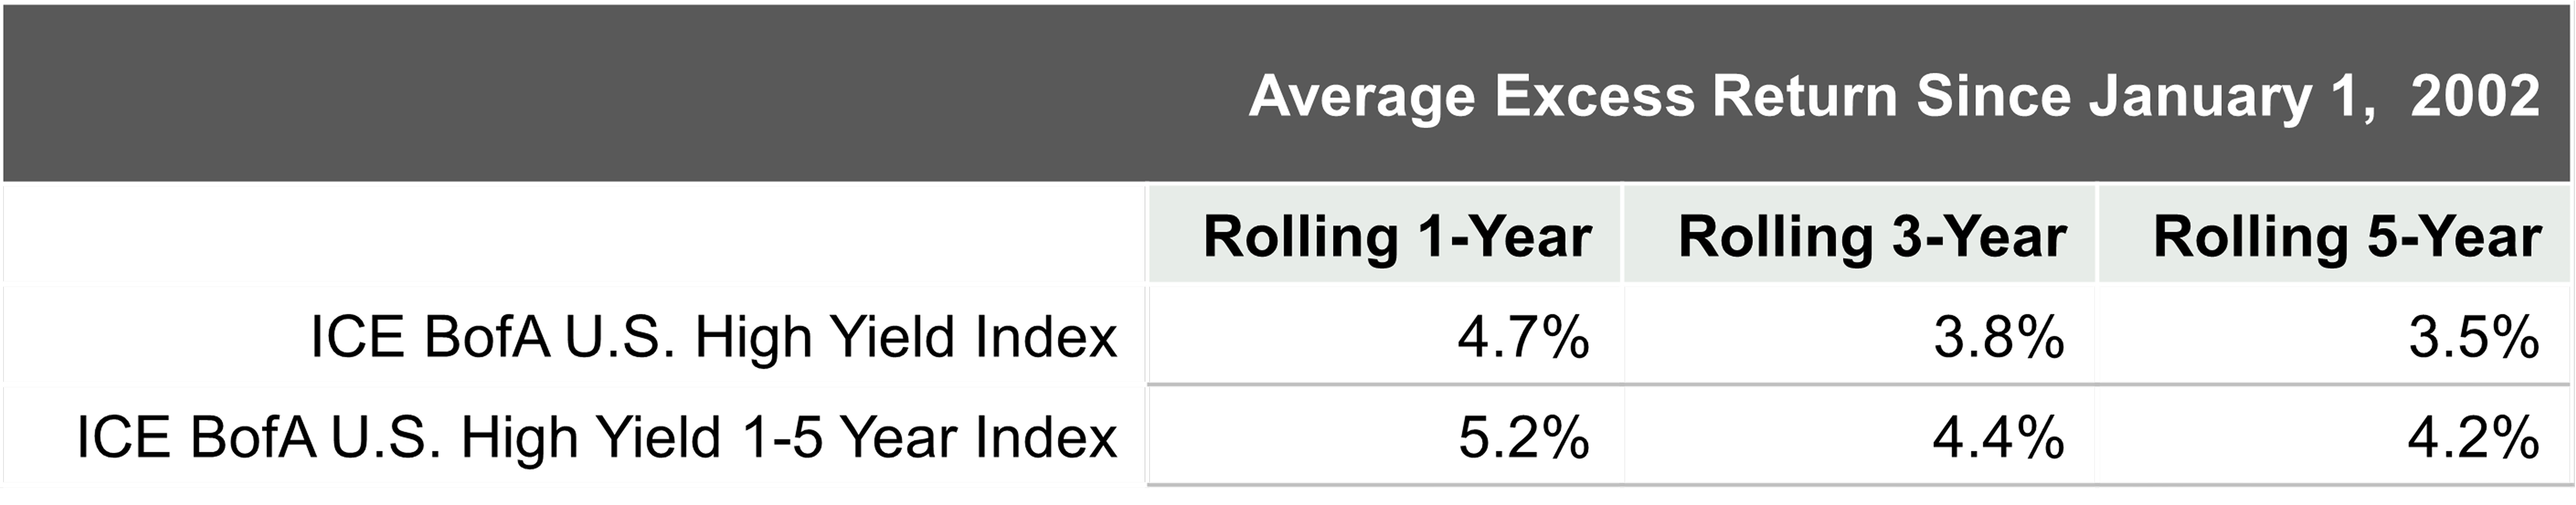
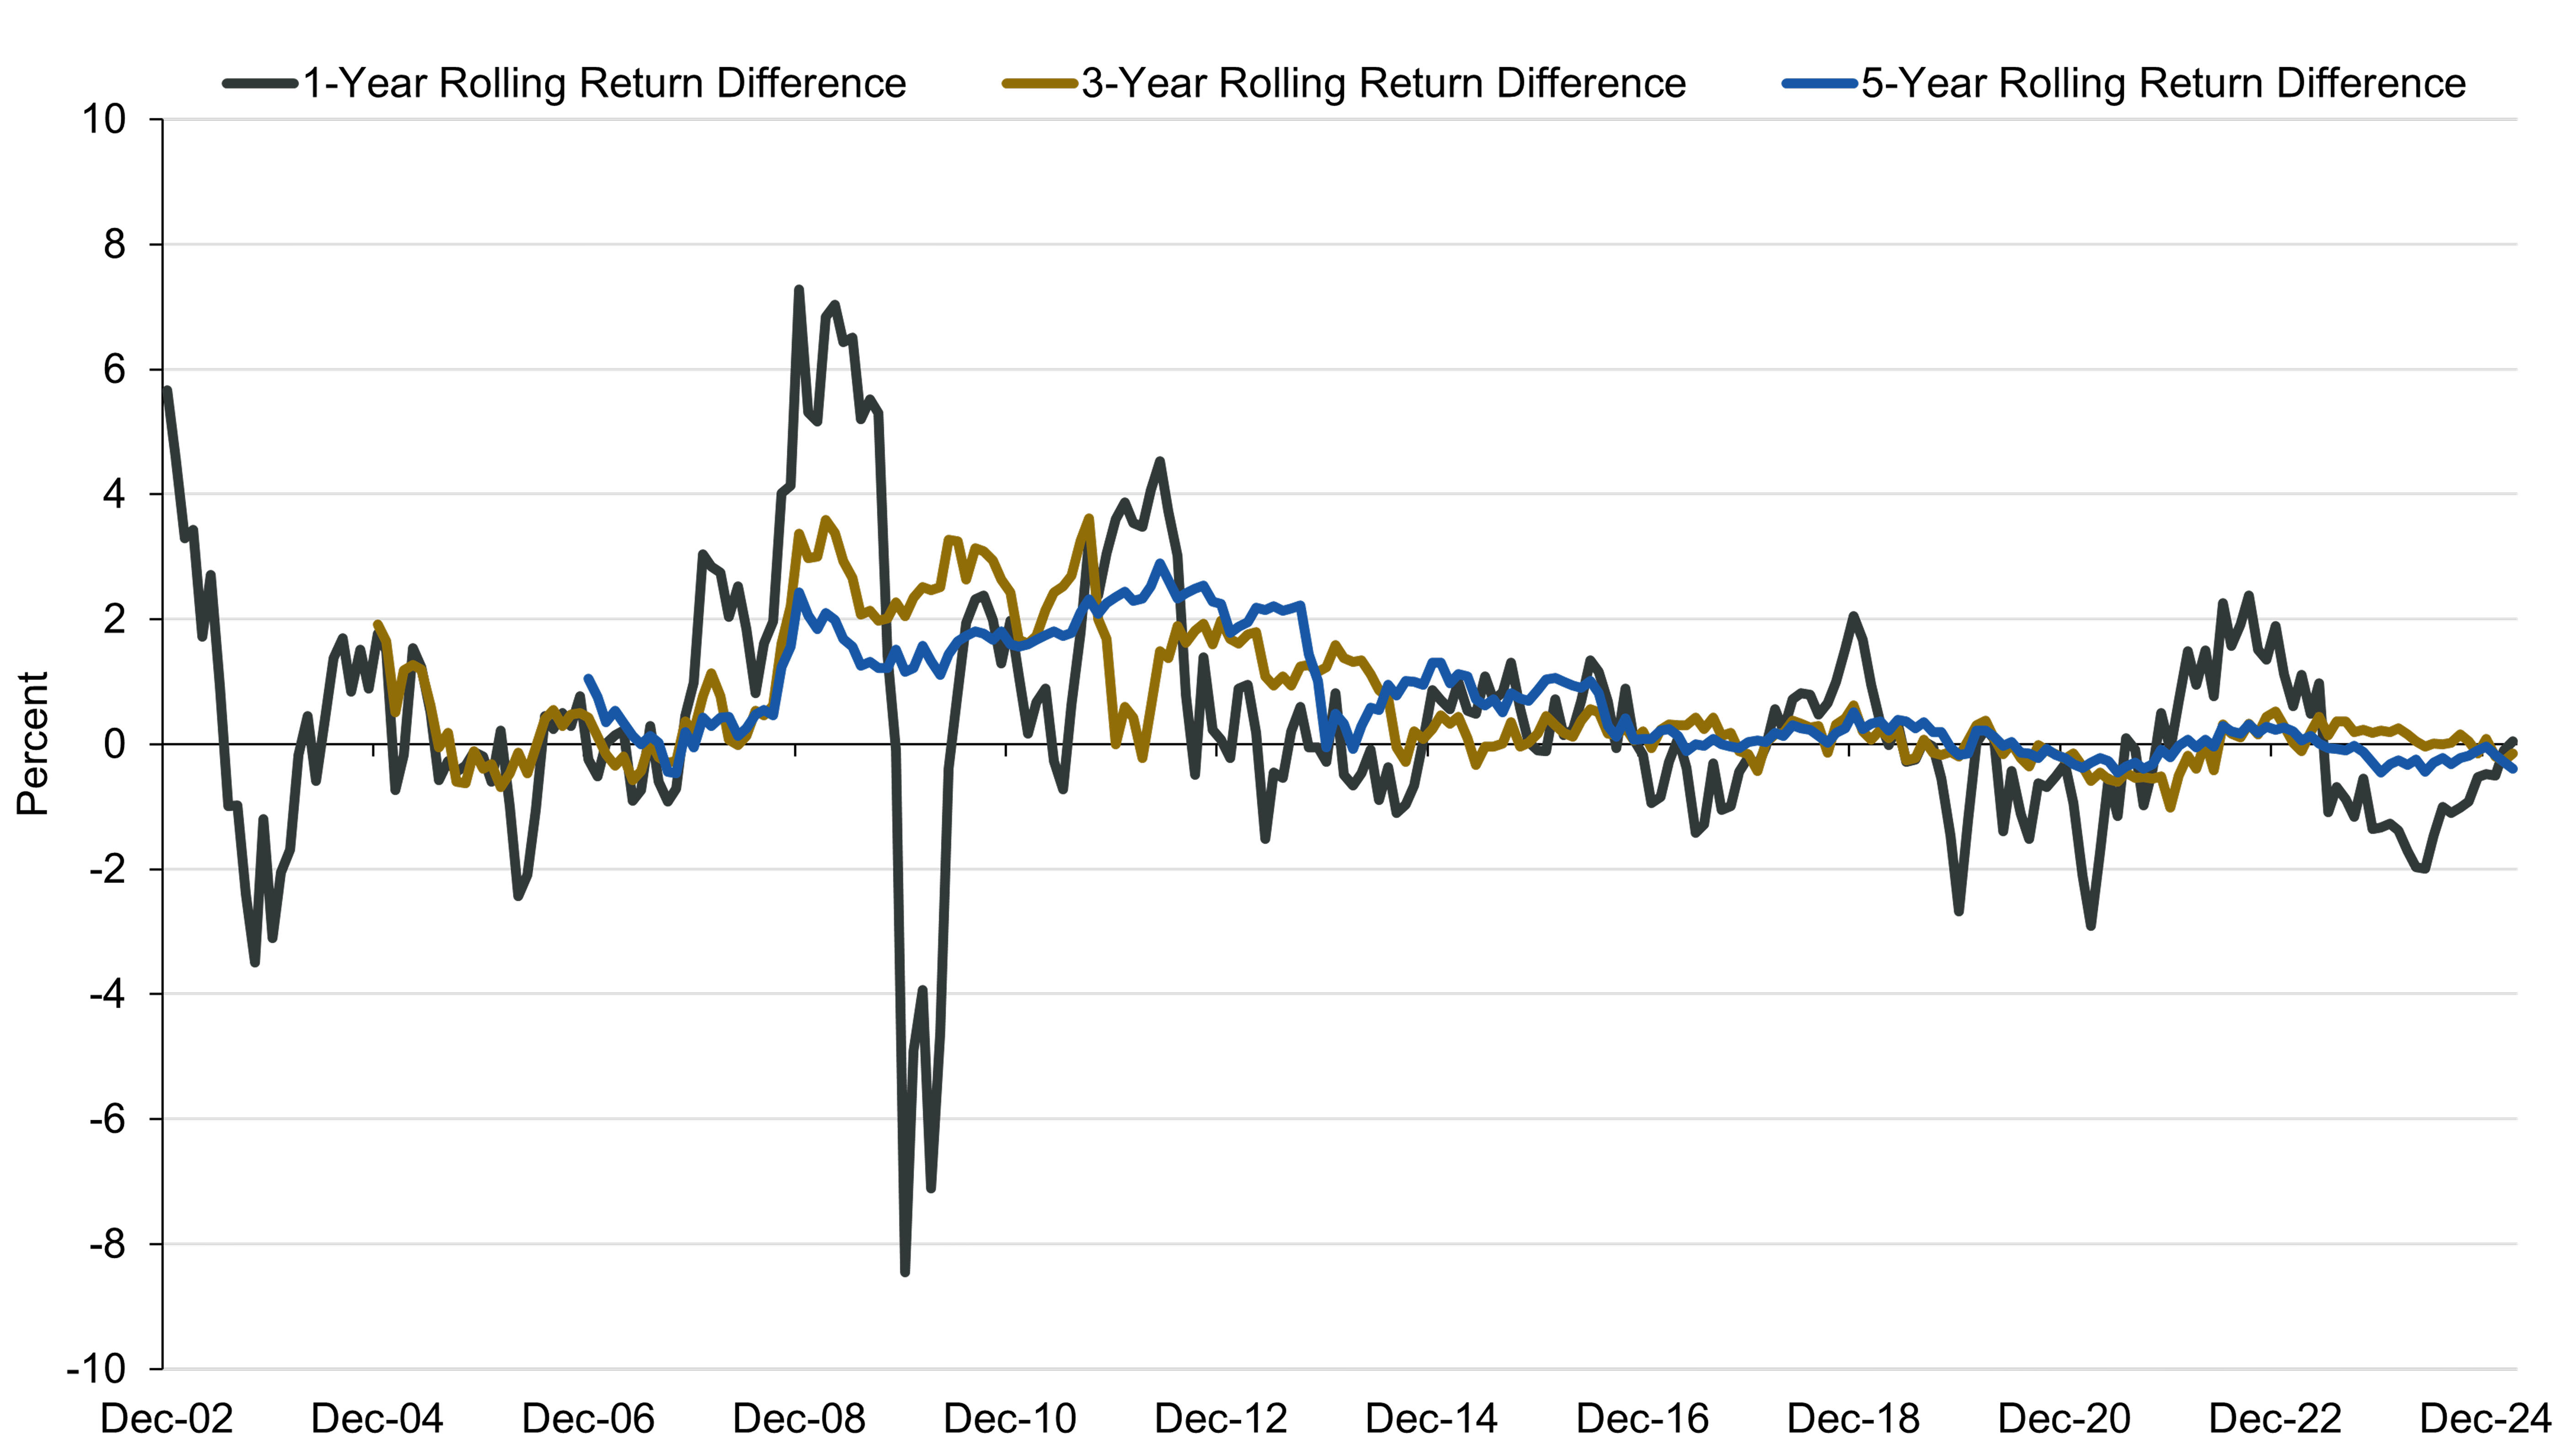
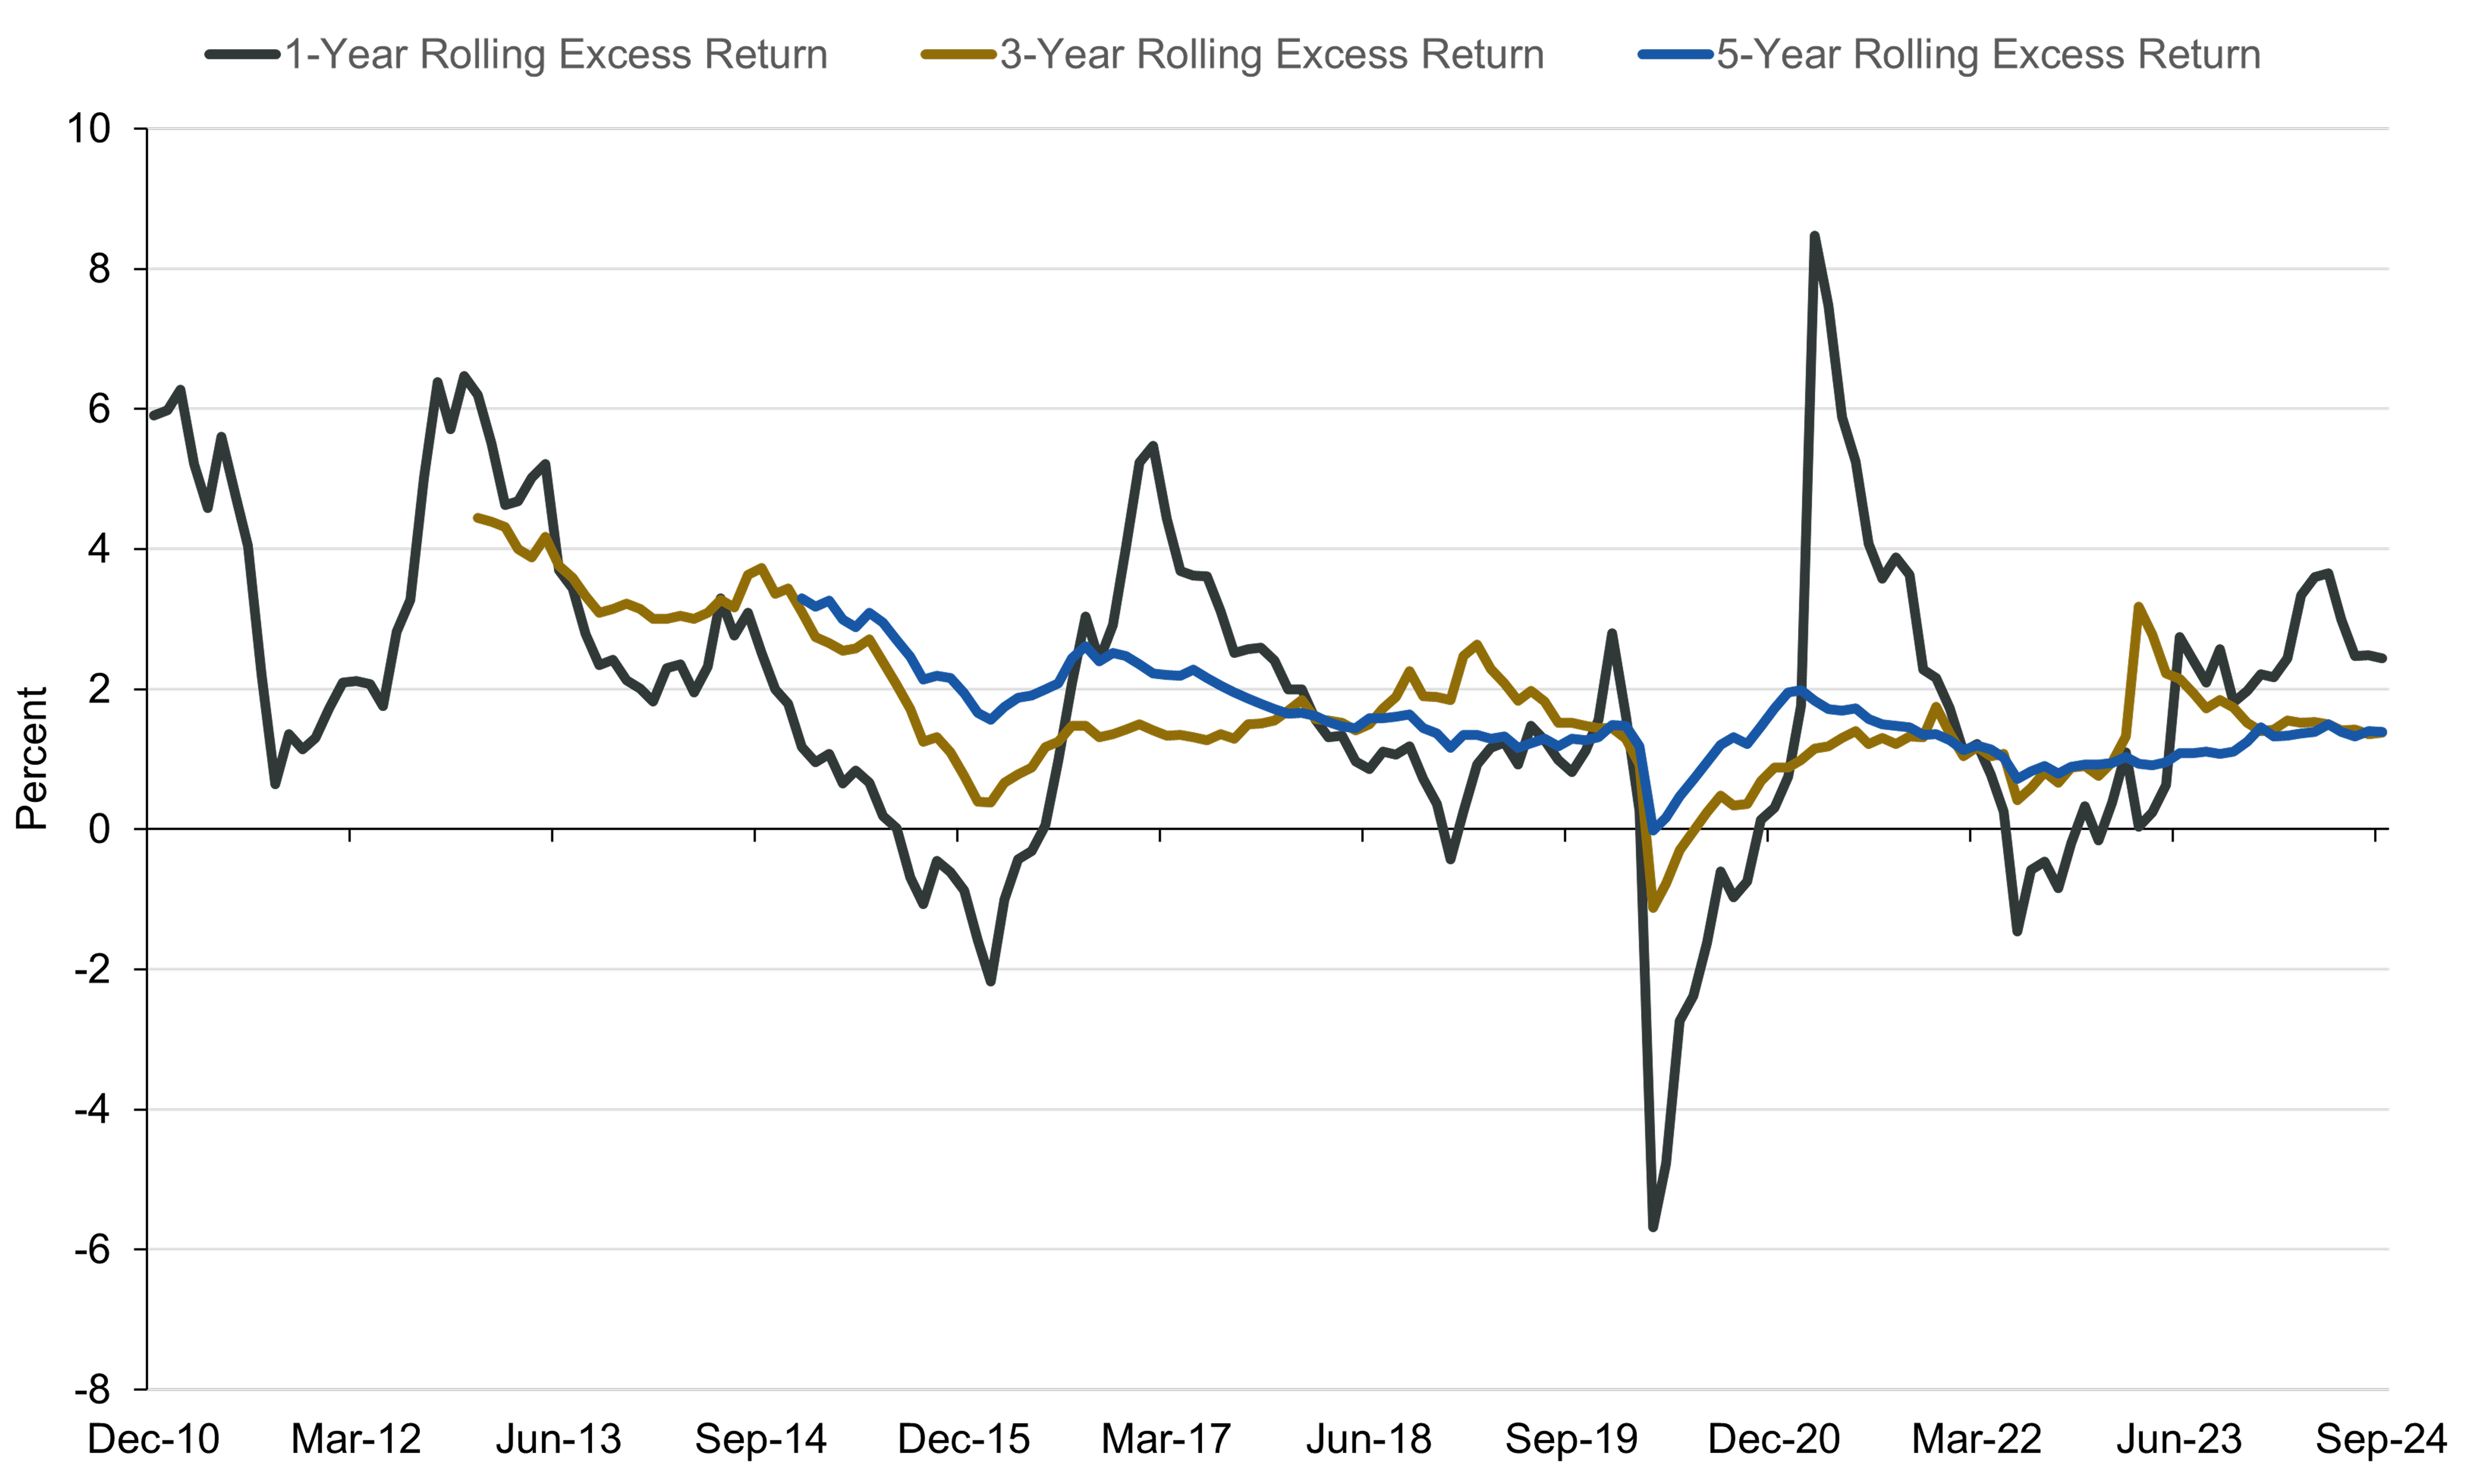
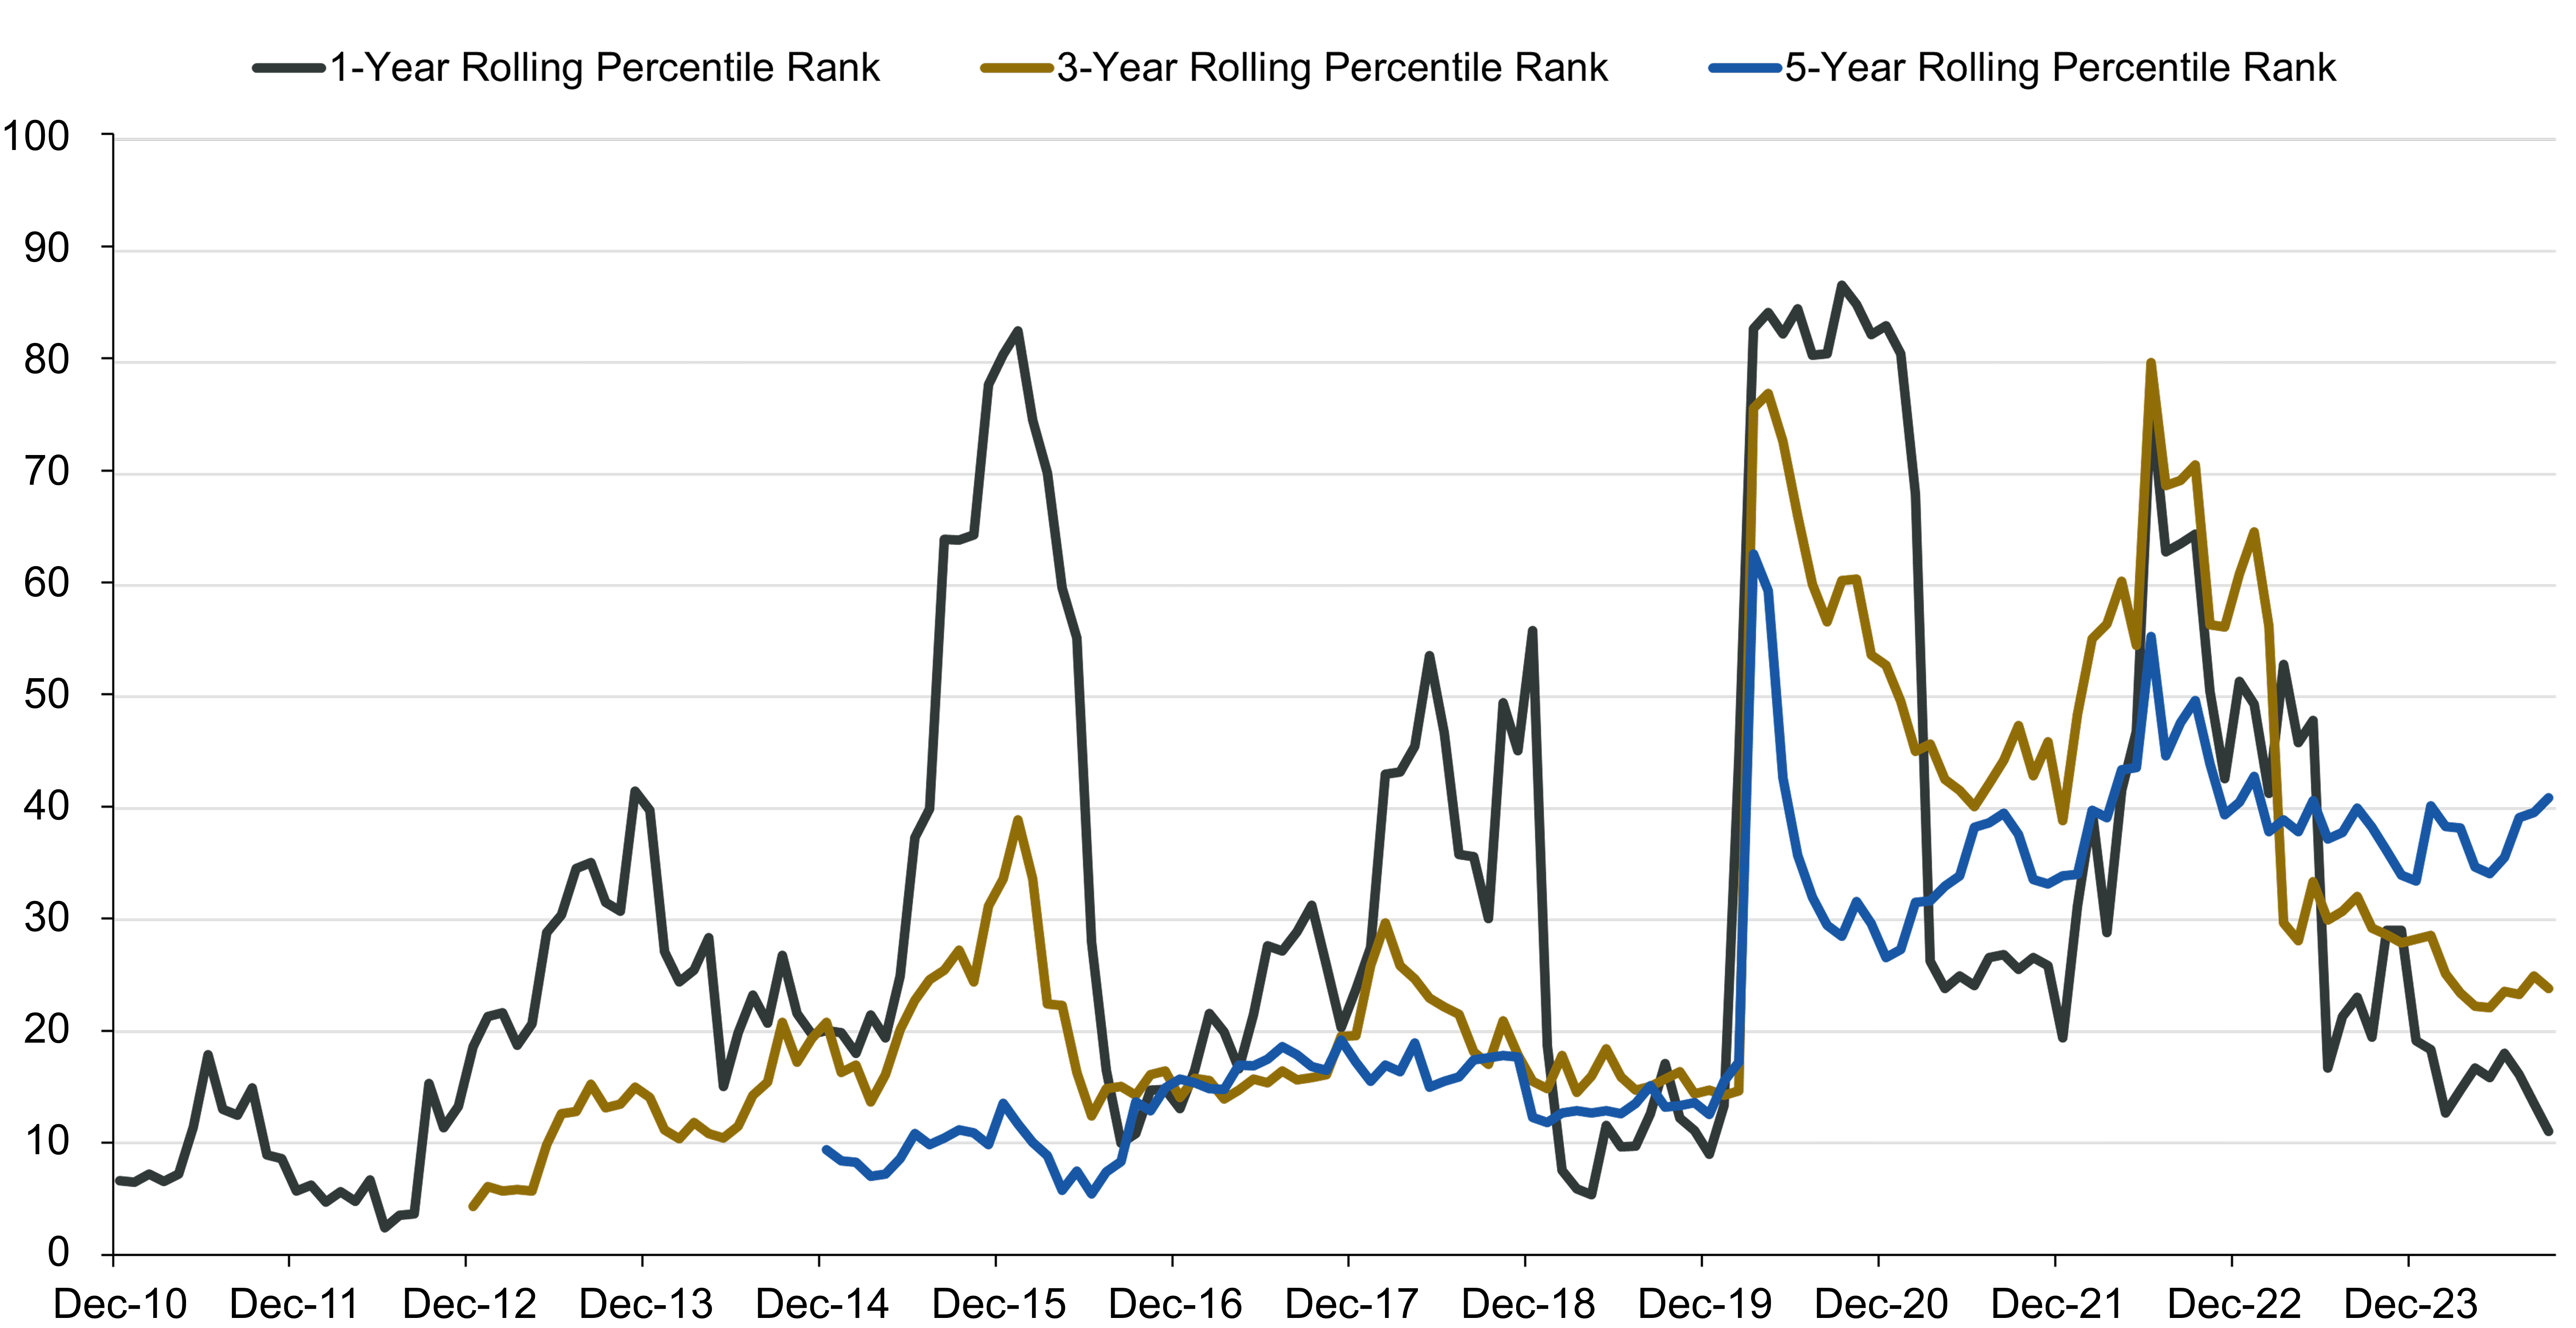
With credit research as a foundation, quantitative insights are also valuable as we seek optimal multi-sector portfolio construction. Specifically, within the high yield sector, an analysis of the short-duration subsector reveals a persistent and attractive risk-adjusted return opportunity.  Figure 1 displays the average excess returns over one-, three-, and five-year rolling periods (since January 2002) for the ICE BofA High Yield Index and the subsector of the index comprised of one- to five-year maturities (1-5 Year Index). Figure 2 displays the time series of the return difference of each of these three rolling periods.  

Figure 1. Attractive Historical Return Opportunity in Short-Duration High Yield Bonds

Average excess returns over one-year, three-year, and five-year rolling periods since January 1, 2002, for the ICE BofA U.S. High Yield Index and the ICE BofA U.S. High Yield 1-5 Year Index

Average Excess return Chart
Source: ICE Data Indices LLC. Data as of February 28, 2025. Excess returns to U.S. government securities. Treasuries are risk-free debt securities issued by the U.S. government and secured by its full faith and credit. Income from Treasury securities is exempt from state and local taxes. The historical data are for illustrative purposes only, do not represent the performance of any specific portfolio managed by Lord Abbett or any particular investment, and are not intended to predict or depict future results. Investors may experience different results. Due to market volatility, the market may not perform in a similar manner in the future. Indexes are unmanaged, do not reflect the deduction of fees or expenses, and are not available for direct investment. Past performance is no indication or guarantee of future performance.

Figure 2. Favorable Index Excess Return of Short-Duration High Yield Rooted in the GFC Period

Return difference between the ICE BofA U.S. High Yield 1-5 Year Index and the ICE BofA U.S. High Yield Index for rolling one-year, three-year, and five-year periods since January 1, 2002

Line Chart for Return difference between the ICE BofA U.S. High Yield 1-5 Year Index and the ICE BofA U.S. High Yield Index for rolling one-year, three-year, and five-year periods since January 1, 2002
Source: ICE Data Indices LLC. Data as of February 28, 2025. GFC = 2008-09 global financial crisis. The historical data are for illustrative purposes only, do not represent the performance of any specific portfolio managed by Lord Abbett or any particular investment, and are not intended to predict or depict future results. Investors may experience different results. Due to market volatility, the market may not perform in a similar manner in the future. Indexes are unmanaged, do not reflect the deduction of fees or expenses, and are not available for direct investment. Past performance is no indication or guarantee of future performance.

The summary table suggests a favorable excess return experience for one- to five-year maturity high yield, and the chart provides further clarity in that much of the favorable excess return experience was rooted in the period of the 2008–09 global financial crisis (GFC). So, it would be unreasonable to declare one- to five-year high yield as the absolute superior subsector within high yield, when a great portion of its outperformance came during a period of historical volatility, uncertainty, and the pricing of this environment into default risk and liquidity risk premiums.

As we highlighted in the October 2024 paper on core bonds, the attractiveness of a favorable excess return is substantiated by a favorable volatility experience. And in Figure 3, we highlight the lower volatility of excess returns for the 1-5-year index when considering rolling three-year periods (one- and five-year rolling period graphs show the same consistent advantage for one- to five-year high yield). Figure 4 shows the lower volatility for shorter high yield across all rolling period averages. Hence, when considering excess returns in combination with the volatility of those returns, we can conclude that the short-duration, high yield subsector has provided a better risk-adjusted return experience.

Figure 3. Favorable Excess Return of Short-Duration High Yield Supported by Favorable Volatility

Rolling three-year annualized volatility for the ICE BofA U.S. High Yield Index and the ICE BofA U.S. High Yield 1-5 Year Index, December 31, 2004-February 28, 2025

Line Chart showing Rolling three-year annualized volatility for the ICE BofA U.S. High Yield Index and the ICE BofA U.S. High Yield 1-5 Year Index, December 31, 2004-February 28, 2025
Source: ICE Data Indices, LLC. Data as of February 28, 2025. Volatility as measured by annualized standard deviation of excess returns. The historical data are for illustrative purposes only, do not represent the performance of any specific portfolio managed by Lord Abbett or any particular investment, and are not intended to predict or depict future results. Investors may experience different results. Due to market volatility, the market may not perform in a similar manner in the future. Past performance is not a reliable indicator or guarantee of future results.

Figure 4. Lower Volatility of Short-Duration High Yield Across Rolling Periods

Rolling one-, three-, and five-year annualized volatility of excess returns for the ICE BofA U.S. High Yield Index and the ICE BofA U.S. High Yield 1-5 Year Index since January 1, 2002

Chart showing Rolling one-, three-, and five-year annualized volatility of excess returns for the ICE BofA U.S. High Yield Index and the ICE BofA U.S. High Yield 1-5 Year Index since January 1, 2002
Source: ICE Data Indices, LLC. Data as of February 28, 2025. Volatility as measured by annualized standard deviation of excess returns. The historical data are for illustrative purposes only, do not represent the performance of any specific portfolio managed by Lord Abbett or any particular investment, and are not intended to predict or depict future results. Investors may experience different results. Due to market volatility, the market may not perform in a similar manner in the future. Past performance is not a reliable indicator or guarantee of future results.

Varying Correlation in a Multi-Sector Composition

Thus far, we have shown the attractiveness of excess returns and the volatility of excess returns by differentiating among a few factors, including rating and maturity. When looking at the standard benchmark of the core and core plus categories, the Aggregate Index, the two largest sectors of spread risk—investment-grade corporates and agency MBS—can be considered for actively managed replacement with investment-grade-rated asset-backed securities (ABS) and commercial mortgage-backed securities (CMBS). And in the core plus category, active management and a focus on short-duration, high yield debt can provide opportunities for strong excess returns with lower volatility, when compared to the broad high yield sector.

While these attractive risk-adjusted return profiles exist over the long term, we believe relative performance expectations and market volatility demand active management in the short- to intermediate-term horizon. And the opportunity for active management is supported by the varying long-term correlations between fixed income sectors, as well as the changing correlations between sectors over time and various market regimes.

In Figure 5, we have selected a subset of sector opportunities in fixed income, represented by ICE BofA and JP Morgan indexes, to present in a correlation matrix when considering excess returns. These sectors include the two significant sectors from the Aggregate Index (investment-grade corporates and agency MBS), ABS, and high yield, which have been our focus through the multi-sector lens, as well as the emerging market sovereign debt sector. Not surprisingly, the highest correlation is between the investment-grade and high yield corporate sectors; otherwise, the range of correlations would confirm the opportunities for active management with a multi-sector focus.

Figure 5. Varying Long-Term Excess Return Correlations Support Active Multi-Sector Opportunity

December 1, 2002-February 28, 2025

Correlation Chart showing Varying Long-Term Excess Return Correlations Support Active Multi-Sector Opportunity
Source: J.P. Morgan and ICE Data Indices LLC. Data as of February 28, 2025. Return correlation measures the degree to which the returns of two securities or asset classes move in relation to each other. A positive correlation indicates that the returns of two securities move in the same direction, while a negative correlation means they move in opposite directions. ABS=asset-backed security. MBS=mortgage-backed security. The historical data are for illustrative purposes only, do not represent the performance of any specific portfolio managed by Lord Abbett or any particular investment, and are not intended to predict or depict future results. Investors may experience different results. Due to market volatility, the market may not perform in a similar manner in the future. Past performance is not a reliable indicator or guarantee of future results.

Figure 6 displays the correlation of rolling one-year excess returns between two sectors, ABS and high yield, and we can see the wide range between negative correlation to nearly 100% positive correlation. This would confirm that the correct identification of market regime, relevant macroeconomic themes, and cross-sector relative value can provide the opportunity for relative performance in an actively managed investment process.

Figure 6. Large Deviation of Returns Between ABS and High Yield Offers an Active Opportunity

Rolling one-year excess return correlation between the ICE BofA ABS Excluding AAA Index and ICE BofA U.S. High Yield Index, December 1, 2002-March 31, 2025

Line Chart showing Rolling one-year excess return correlation between the ICE BofA ABS Excluding AAA Index and ICE BofA U.S. High Yield Index, December 1, 2002-March 31, 2025
Source: ICE Data Indices LLC. Data as of March 31,2025. Return correlation measures the degree to which the returns of two securities or asset classes move in relation to each other. A positive correlation indicates that the returns of two securities move in the same direction, while a negative correlation means they move in opposite directions. The historical data are for illustrative purposes only, do not represent the performance of any specific portfolio managed by Lord Abbett or any particular investment, and are not intended to predict or depict future results. Investors may experience different results. Due to market volatility, the market may not perform in a similar manner in the future. Past performance is not a reliable indicator or guarantee of future results.

The Potential of Multi-Sector Risk Expertise and Active Management 

Advantageous risk-adjusted returns in short-duration, high yield debt, and high quality securitized debt—and changing correlations between these sectors along with all other sub-sectors of fixed income—can all set the stage for a successful investment experience within the core plus category. But what is the potential here? To answer this question, we expanded upon our analysis to understand the risk, volatility, and return potential of all fixed income opportunities and designed a fixed-weight multi-sector portfolio to drive attractive risk-adjusted returns relative to the Aggregate Index. This fixed-weight multi-sector portfolio is a combination of featured sectors within ICE BofA indexes, including ABS, CMBS, investment-grade and high yield corporate bonds, U.S. Treasuries, and the JPMorgan Emerging Markets Sovereign index.  We began the analysis of excess returns post-GFC (December 31, 2009), given the availability of index data, in order not to drive too much benefit from the significant tightening in spreads in the immediate aftermath of the crisis.

Looking at Figure 7, we can make a few observations:

  • The fixed-weight multi-sector portfolio has an average excess return for the one-, three-, and five-year rolling periods of 190, 180, and 160 basis points (bps), respectively.
  • We can see that the five-year rolling excess return only goes slightly negative in March 2020, when the market began to feel the impact of the emergence of COVID-19.
  • The fixed-weight multi-sector portfolio has significant credit risk relative to the index, evinced by the significant one-year underperformance of the portfolio during periods of risk-off investor behavior, e.g., the 2015 oil shock and the COVID-19 disruption mentioned earlier, as well as the material bounce back in performance upon a recovery and reversion in spreads. 

Figure 7. Fixed-Weight Multi-Sector Excess Returns Versus the Aggregate Index

Rolling one-, three-, and five-year excess returns of fixed-weight portfolio (as defined) to Bloomberg U.S. Aggregate Bond Index, December 31, 2009-September 30, 2024

Line Chart showing Rolling one-, three-, and five-year excess returns of fixed-weight portfolio (as defined) to Bloomberg U.S. Aggregate Bond Index, December 31, 2009-September 30, 2024
Source: ICE Data Indices and J.P. Morgan. Data as of February 28, 2025. The fixed-weight multi-sector portfolio includes a combination of featured sectors within ICE BofA indices, including ABS, CMBS, investment-grade corporates, high yield corporates, U.S. Treasuries, and the JPMorgan Emerging Markets Sovereign index. The historical data are for illustrative purposes only, do not represent the performance of any specific portfolio managed by Lord Abbett or any particular investment, and are not intended to predict or depict future results. Investors may experience different results. No investor achieved these returns. Due to market volatility, the market may not perform in a similar manner in the future. Past performance is not a reliable indicator or guarantee of future results.

Further, in Figure 8, we can share what the above excess returns would have translated to within eVestment peer rankings. With lower absolute numbers representing favorable peer rankings, the fixed-weight multi-sector portfolio would have average peer rankings for the one-, three-, and five-year rolling periods of the 31st, 28th, and 25th percentiles, respectively. Importantly, and to reiterate, this is a fixed-weight multi-sector portfolio; hence, this performance among peers derives zero benefit from what a successful active management approach could have provided, including:

  • Mitigating overall portfolio risk given valuations and the fundamental macroeconomic environment.
  • Modifying sector allocation in the face of changing correlations of sector return as well as relative value opportunities given market and macroeconomic themes.
  • Security selection decisions driven by credit research analysts who recognize mispricing of risk owing to their proprietary and potentially variant perception of relative value.

Figure 8. Comparing Fixed-Weight Multi-Sector Allocation to eVestment Peer Group

Rolling one-, three-, and five-year excess return percentile rank of fixed-weight portfolio (as defined) within the eVestment Core Plus Fixed Income Universe

Line Chart showing Rolling one-, three-, and five-year excess return percentile rank of fixed-weight portfolio (as defined) within the eVestment Core Plus Fixed Income Universe
Source: eVestment and Lord Abbett. Percentile rank is a statistical measure that indicates the relative standing of a value within a dataset. It expresses the percentage of scores in each dataset that fall below a specific value. The fixed-weight multi-sector portfolio includes a combination of featured sectors within ICE BofA indices, including ABS, CMBS, investment-grade corporates, high yield corporates, U.S. Treasuries, and the JPMorgan Emerging Markets Sovereign index. The historical data are for illustrative purposes only, do not represent the performance of any specific portfolio managed by Lord Abbett or any particular investment, and are not intended to predict or depict future results. Investors may experience different results. Due to market volatility, the market may not perform in a similar manner in the future. No investor achieved these returns. Past performance is not a reliable indicator or guarantee of future results.

Summing Up

We believe that in the core plus category, investment success can be found through strong insights and awareness of risk and correlations between the numerous sectors and subsectors within fixed income. In addition, strength in active management, which we can define as an ability to control portfolio risk and volatility efficiently, a willingness to rotate sectors based on relative value and fundamental outlook, and an ability to add value through security selection and the identification of spread premium mispricing, is equally important to investment success.  In the nine-decade-plus history of Lord Abbett, a defining aspect of our success in active portfolio management has been a philosophy centered around elite fundamental credit research capabilities and the optimal multi-sector approach to deliver expected returns with appropriate volatility for all clients.