An Introduction to the CLO Framework

Collateralized Loan Obligations (CLOs) are special purpose vehicles (SPVs) that invest in a diversified pool of senior secured bank loans. CLO issuers raise capital to fund these structures by issuing tranches of debt, each representing varying levels of risk and return. The cash flows from the underlying loans are distributed to the CLO investors based on the seniority of the tranche they hold (see Figure 1). The highest-rated (AAA) tranche receives payments first and has the lowest risk, while the equity tranche, which receives the residual cash flows from the assets that exceed what is owed to the debt, represents the “first-loss” capital but offers higher potential upside. 

Figure 1. Revisiting the CLO Capital Structure

CLO Capital Structure Diagram
Source: Bloomberg. Percentages within each tranche are hypothetical estimates based on a typical CLO structure. For illustrative purposes only and does not represent any specific portfolio managed by Lord Abbett or any particular investment. 

CLO equity has historically delivered attractive long-term results, even during difficult markets. Below, we discuss factors that have contributed to strong outcomes over time, and particularly for the equity tranches of CLOs that were issued immediately before or during periods of market volatility. For a more general overview of CLO equity, please read Time to Consider CLO Equity.

Because an investment in the equity tranche of a CLO represents a leveraged exposure to bank loan assets, short- and long-term returns for CLO equity investors are influenced by the returns of underlying bank loans, which are driven by interest payments, credit losses, and impacts from trading. On average, the equity tranches of redeemed CLO deals have experienced positive internal rates of return (IRRs) over the life of each vintage (based on 2003–2020 vintage data) according to BofA Global Research. In fact, some of the highest-returning vintages of CLO equity were from deals originated just prior to the global financial crisis (GFC) in 2007 and at the onset of the COVID-19 pandemic in 2020, shown in Figure 2. In our view, there are several important reasons for this.

Figure 2. Historically Strong CLO Equity Results Were Generated During Volatile Periods

Median IRR data comprised of redeemed (non-static) deals from vintages 2007 and 2020 and the weighted average across 2003–2020 vintages.

Bar Chart showing Median IRR data comprised of redeemed (non-static) deals from vintages 2007 and 2020 and the weighted average across 2003–2020 vintages.
Source: Bank of America (BofA) Global Research as of February 2025. IRRs comprised of redeemed, non-static deals. Non-static deals refer to CLO structures that allow for active management of the underlying loan portfolio. A vintage is the year the CLO was originated. The historical data shown above are for illustrative purposes only and do not represent any specific portfolio managed by Lord Abbett or any particular investment. Indexes are unmanaged, do not reflect the deduction of fees or expenses, and are not available for direct investment. Past performance is not a reliable indicator or guarantee of future results.

The Appeal of BSLs as CLO Collateral

The first reason is the depth and soundness of the BSL market. As an asset class, the bank loan market now stands at nearly $1.5 trillion outstanding.1 This provides a broad array of sectors and issuers for CLO managers to choose from when sourcing attractive credits. In addition, BSLs are typically senior in borrowers’ capital structures, and are issued with floating rate coupons. These structural features help mitigate both credit and interest rate risk.

Figure 3. Bank Loans Have a History of Low Default and Estimated Loss Rates

Annual bank loan default and estimated loss rates

Bar chart showing annual bank loan default and estimated loss rates
Source: J.P. Morgan Research as of December 2024. *Estimated loss rate calculated as annual default rate (including distressed exchanges) * (100% - annual average recovery rate). The historical data shown above are for illustrative purposes only and do not represent any specific portfolio managed by Lord Abbett or any particular investment. Indexes are unmanaged, do not reflect the deduction of fees or expenses, and are not available for direct investment. Past performance is not a reliable indicator or guarantee of future results.

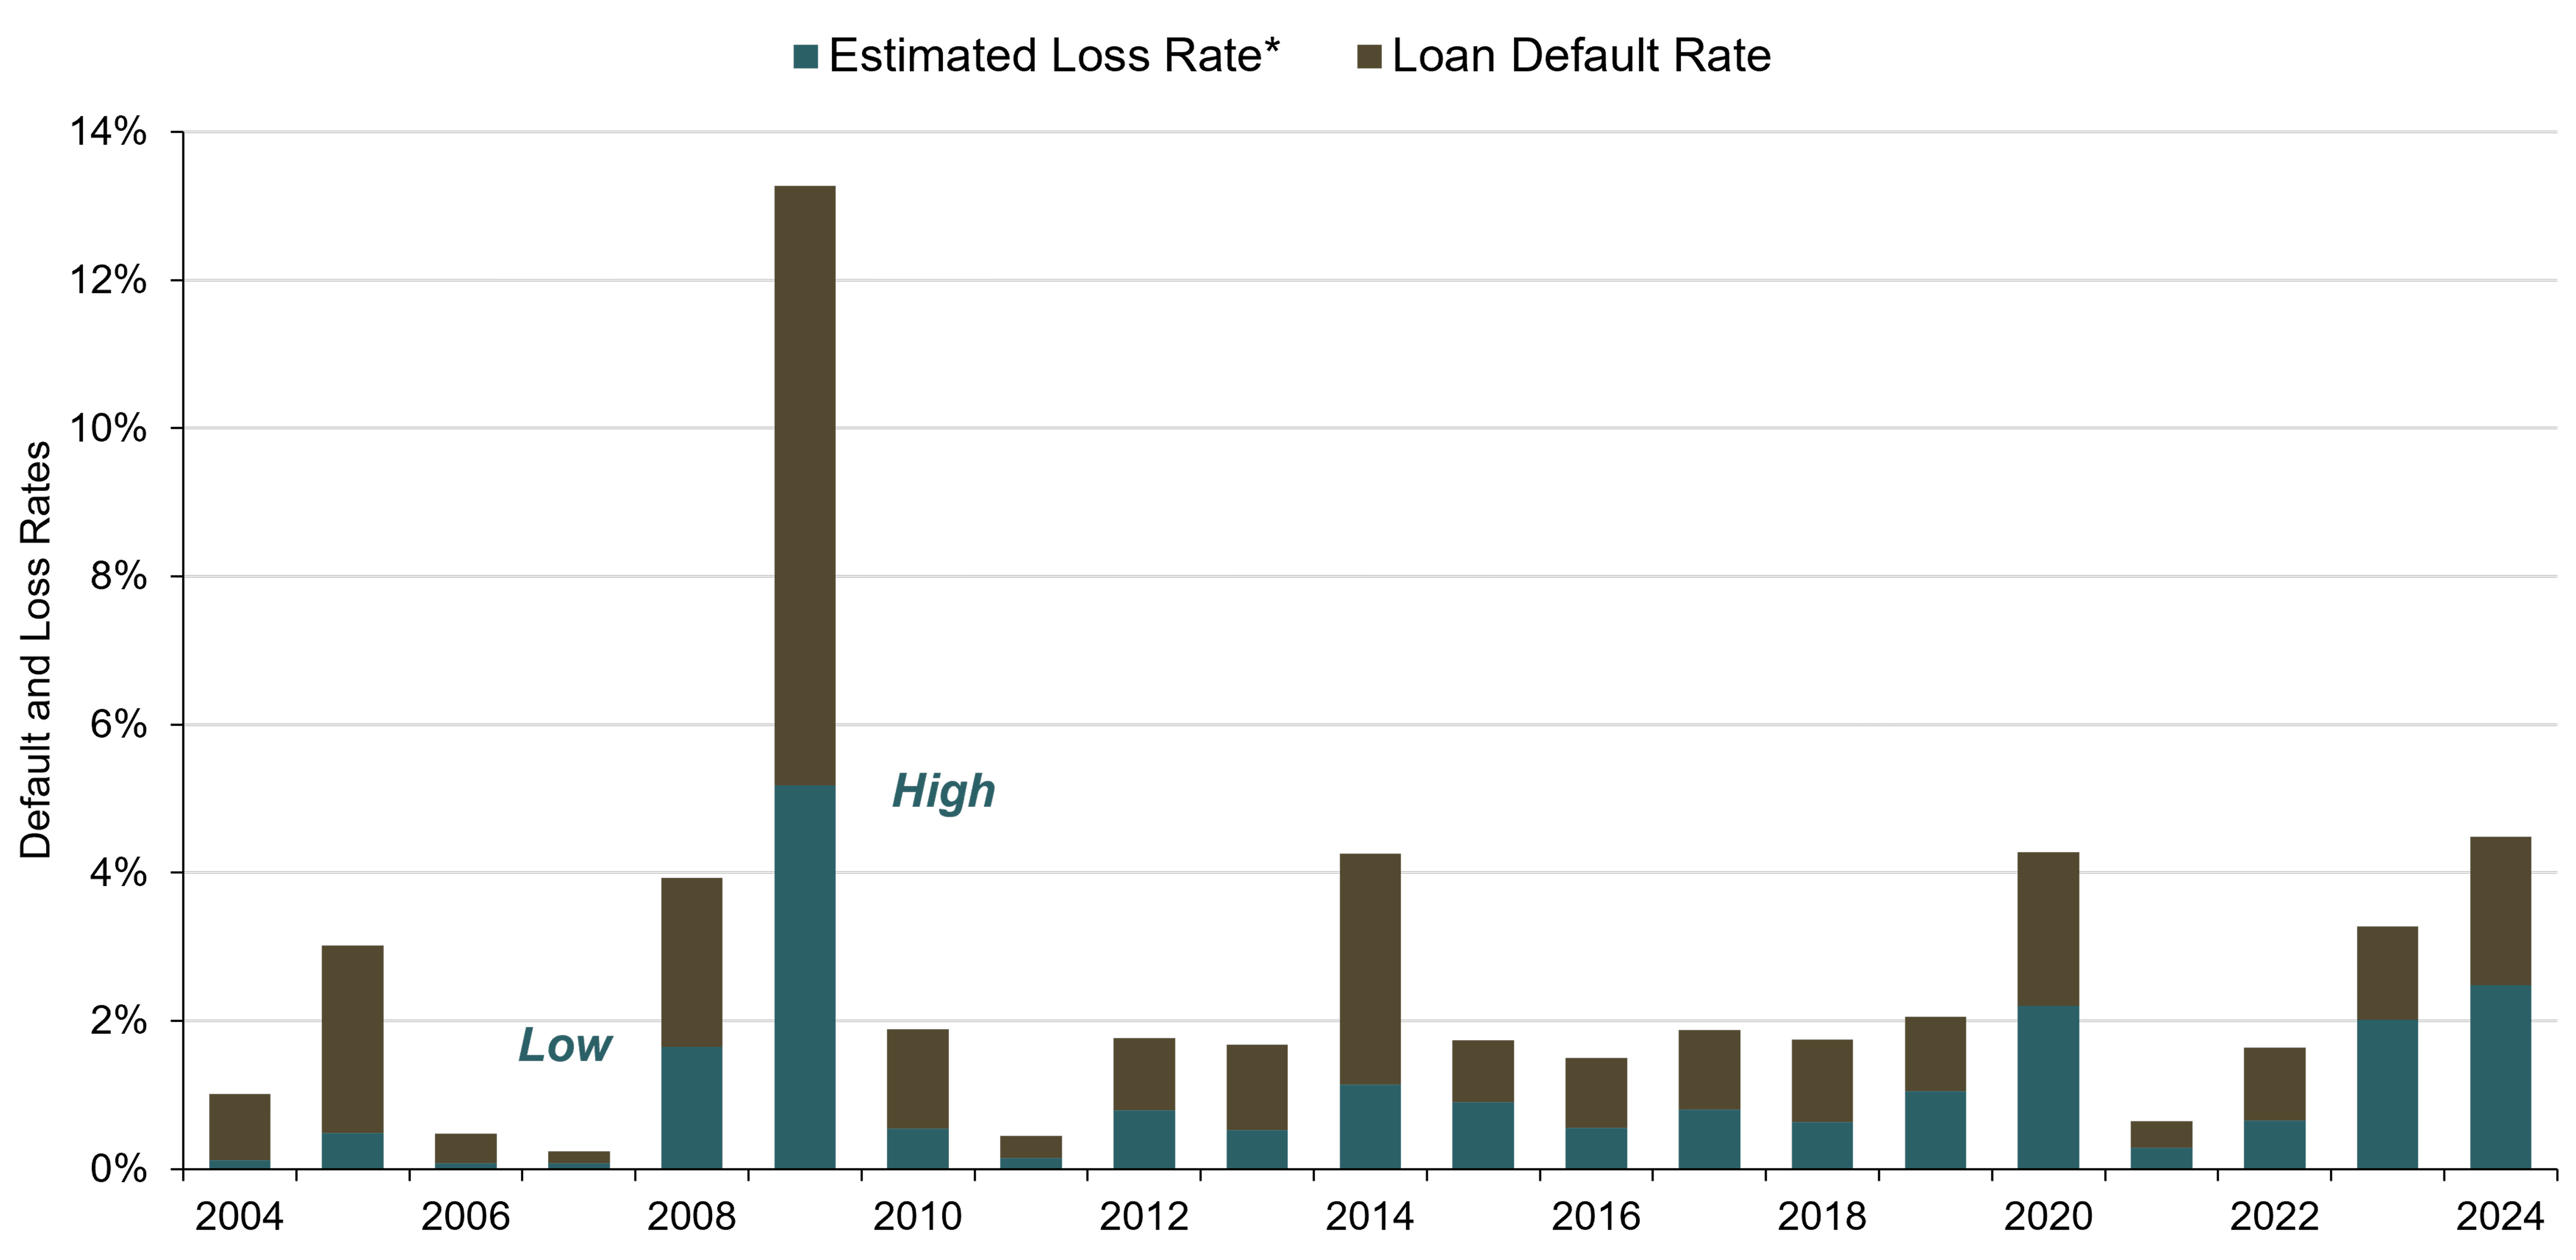
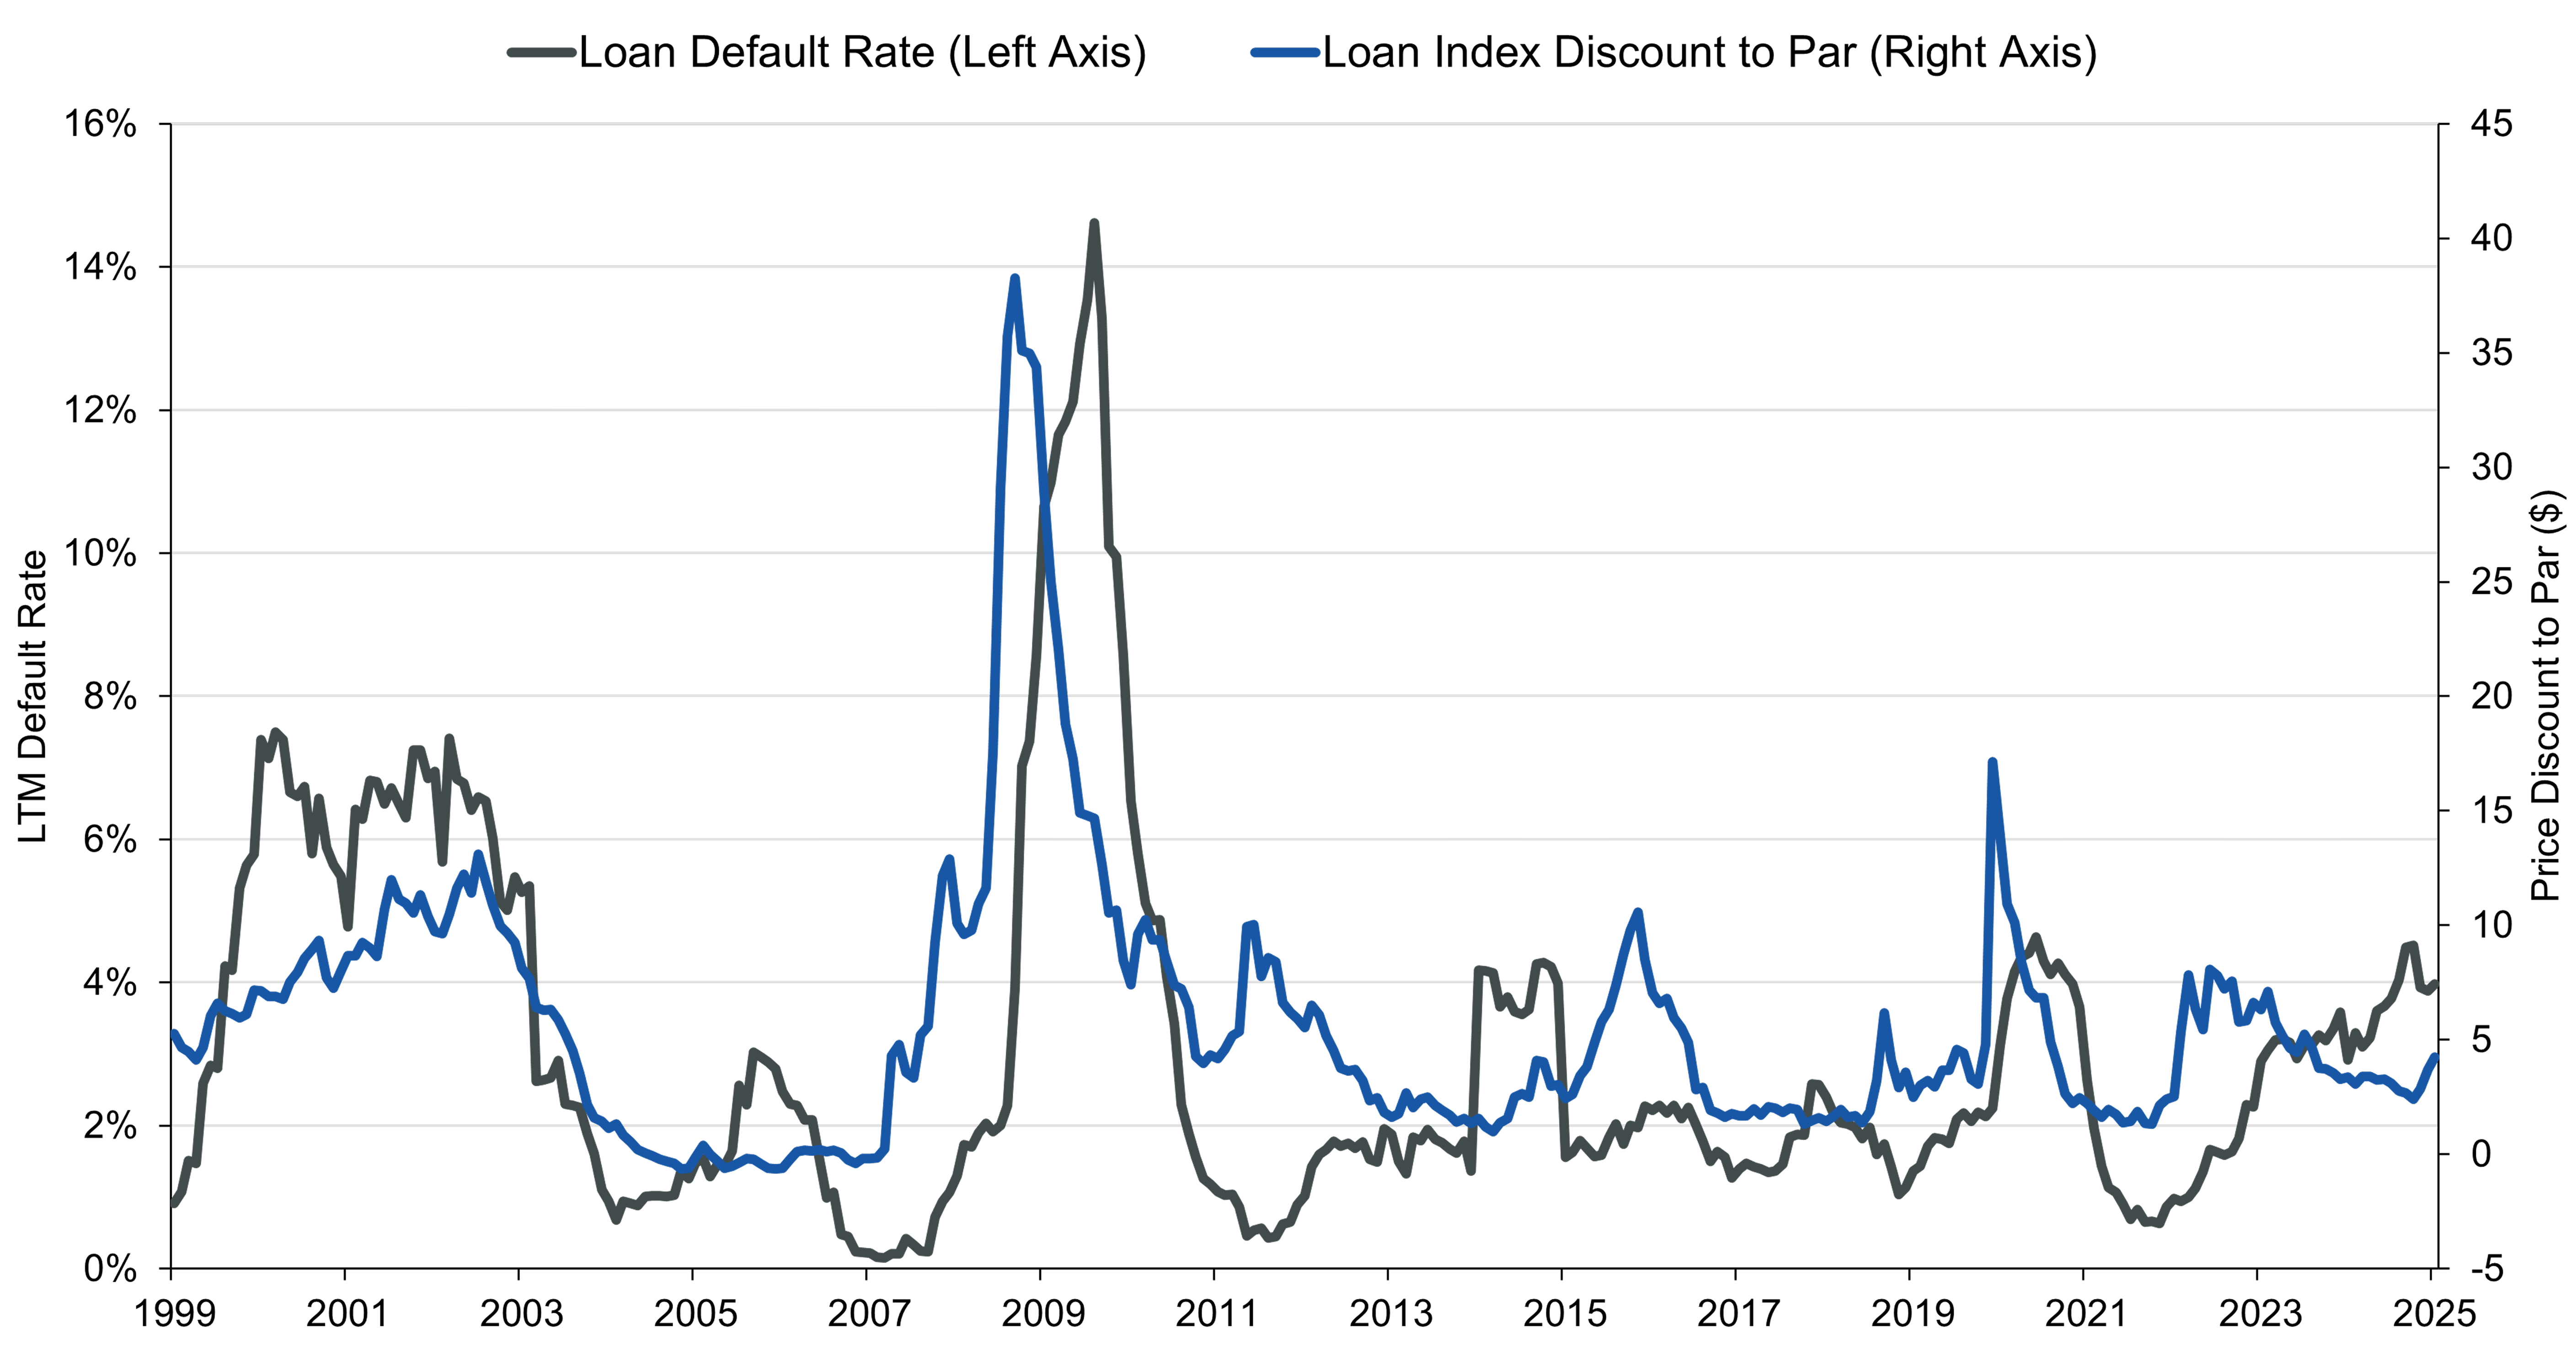
Figure 3 shows that the BSL market has historically experienced relatively low defaults and low loss severities through multiple credit cycles due to the senior and secured nature of the asset class.

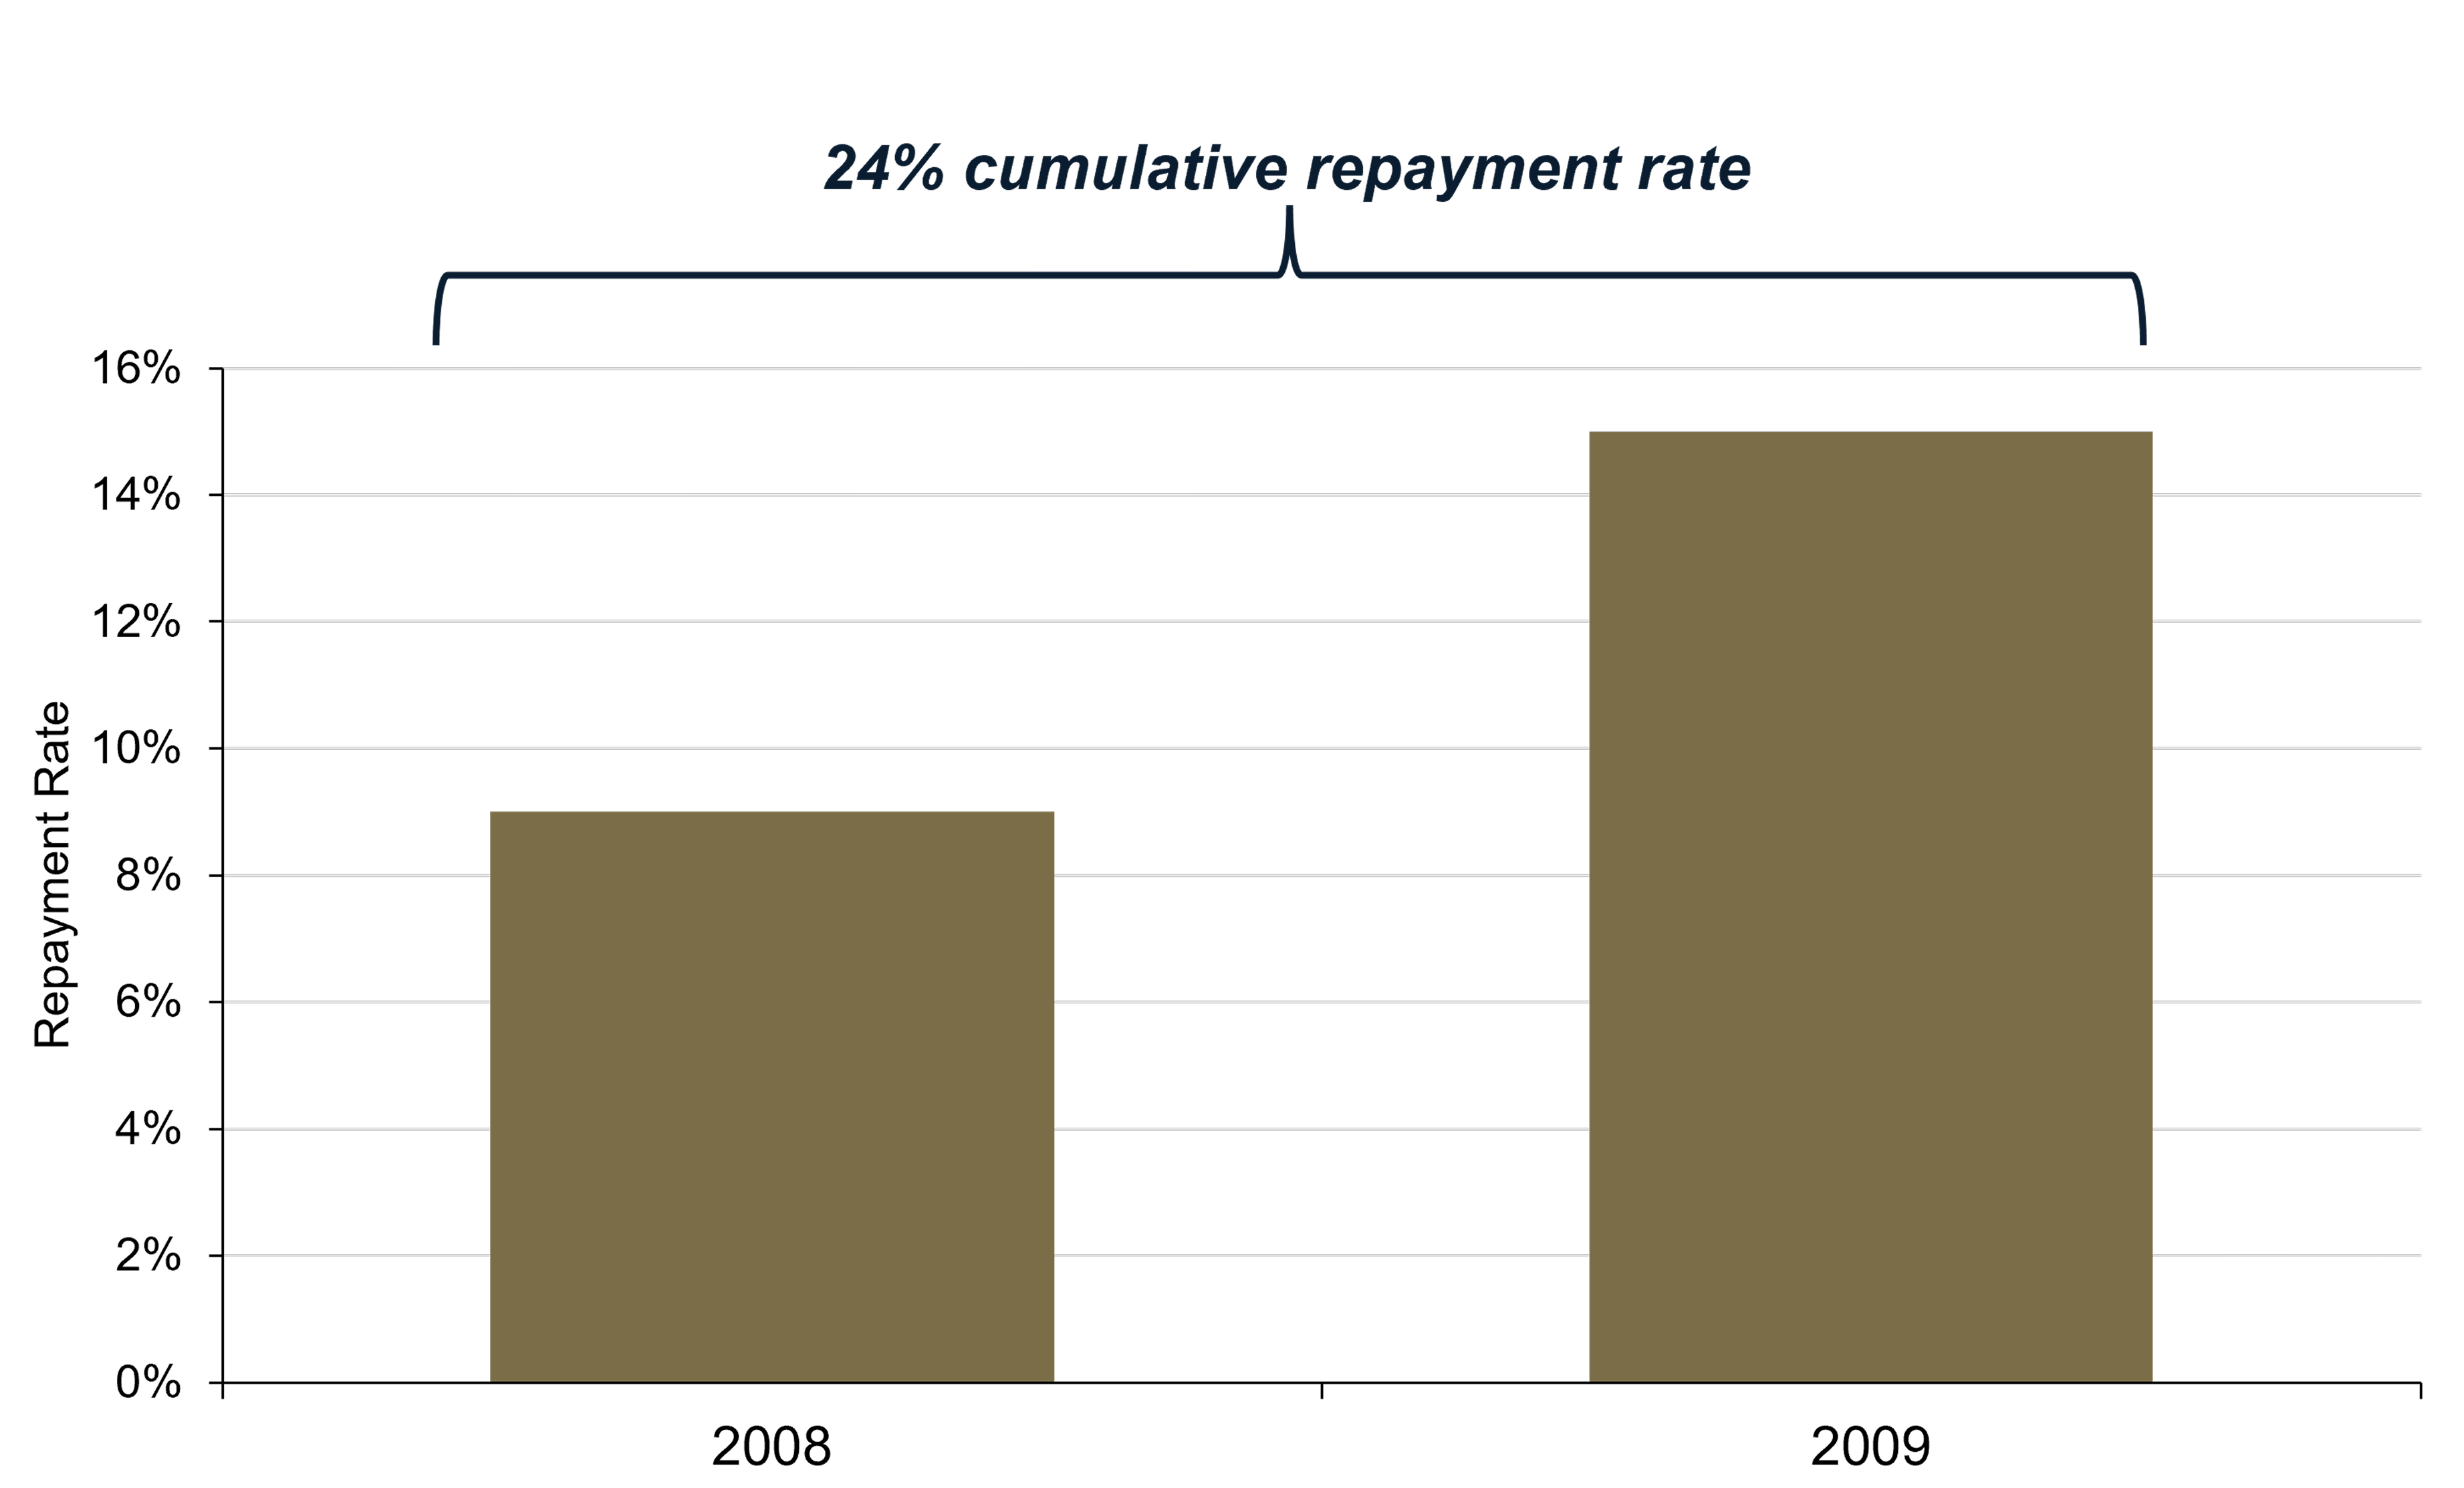
Additionally, loans are typically issued with limited call protection given to lenders, which has led to frequent prepayments prior to maturity. This feature can benefit CLO equity in weaker markets. While it may seem counterintuitive, when BSL prices are deteriorating, a portion of issuers typically still elect to pay off their loans ahead of schedule, even in the face of significant economic turmoil. This occurred during the GFC in 2008 and 2009, when almost one quarter of BSL issuers repaid their loans ahead of maturity. Because prepayments typically occur at par, this dynamic creates unencumbered capital that can be put to work by CLO managers at prevailing discounted market rates.2 During such periods of volatility, the flexibility to invest in loans at elevated spreads and discounted prices can lead to meaningful price upside as those investments mature at par or are sold at a gain. This can help to enhance returns and potentially mitigate or even overwhelm the impact of credit losses that may stem from defaults over the same period.

Structural Attributes of the CLO Vehicle

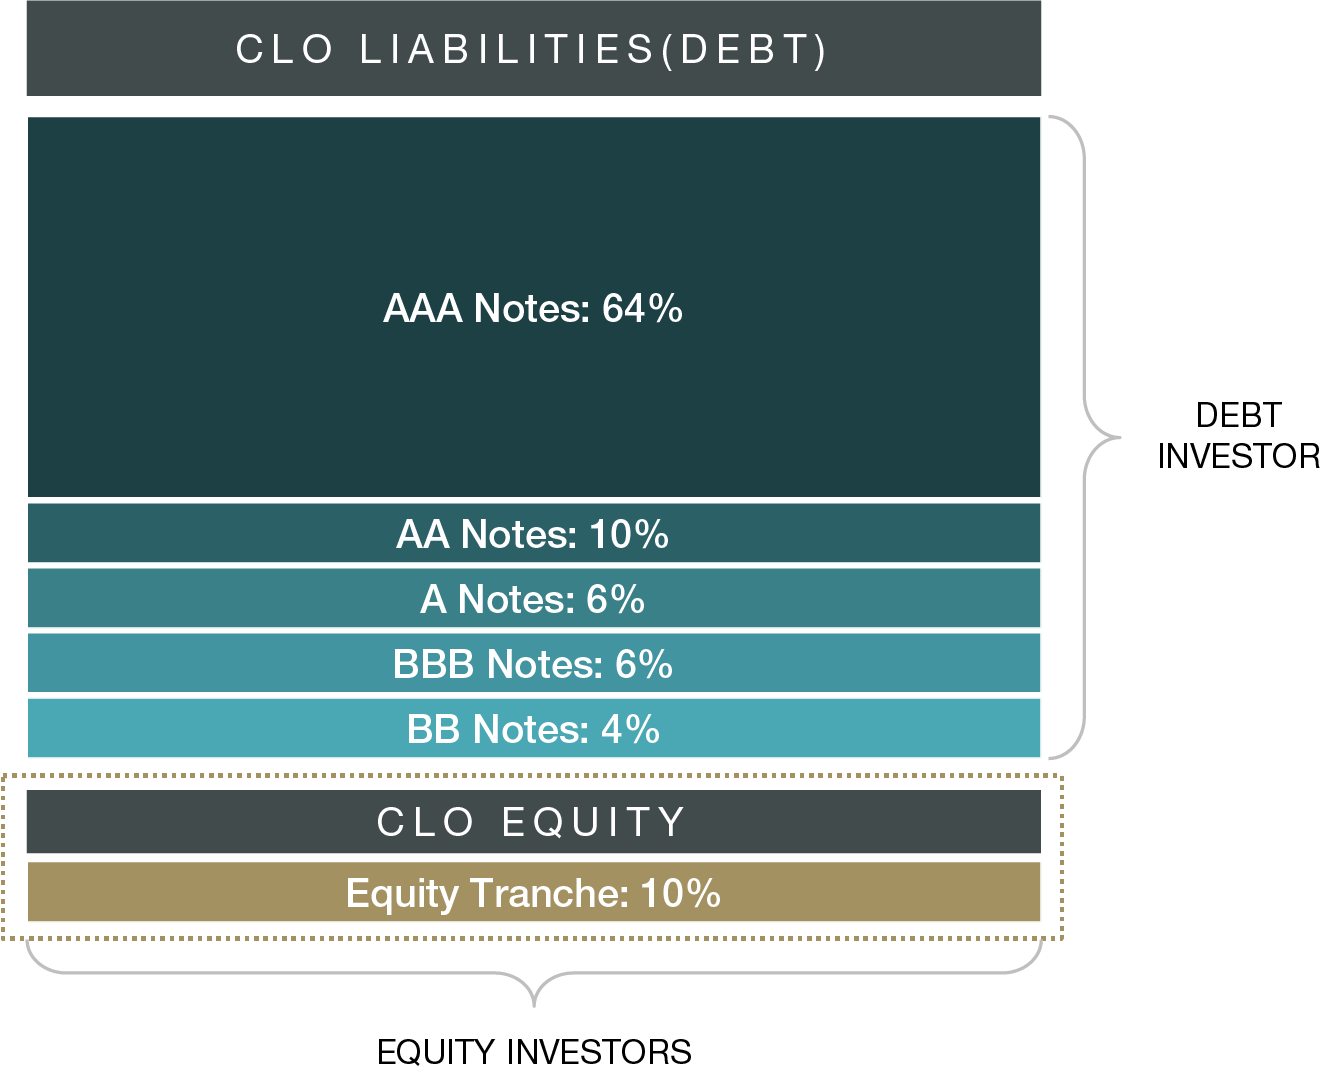
The difference between what a CLO pays to finance its debt (liabilities) and the return it receives from its BSL holdings (assets), or the arbitrage (“arb”), is at the core of what drives performance for the equity tranche investor. This spread between cost of capital on the debt and collateral return flows down the waterfall debt stack, paying each debt tranche as agreed, with excess cash flows—net of credit losses and fees—accruing to the equity investors. A typical CLO vehicle has several attributes that distinguish it from other types of waterfall securitized products. While most securitized products are limited in their ability to adapt to changing markets, CLO managers are able to actively manage both the assets (BSL collateral) and the liabilities (CLO debt tranches).

On the debt side, the manager’s cost of capital is effectively “locked in” for the life of the vehicle at the time of inception, based off the same rate (Secured Overnight Funding Rate or SOFR) as the underlying BSL collateral. It is also financed against the par value of the collateral and not subject to margin requirements based on the mark-to-market pricing of the collateral. These features are important as they provide certainty on the financing a CLO uses, which can remain in place for the life of the assets.

While the debt financing can remain in place—even if conditions in the market worsen—if financing conditions in the market improve, CLO equity holders have the option to refinance the debt largely at their discretion following a non-call period. For instance, if a CLO were to be issued during a period of wide spreads on debt, the majority equity holders retain the option to refinance at a lower spread level once things calm down, potentially locking in a lower rate that will remain until the end of the term of the CLO. The exercise of this optionality has the potential to provide attractive return benefits to the equity holder as the “arb” improves, allowing more capital to flow to the bottom of the structure.

On the asset side, CLO managers actively manage the underlying loan exposure throughout the majority of the term of the vehicle. In periods where BSL market prices decline, managers are able to take advantage of discounted loans to not only increase the yield on the collateral pool, thereby boosting the arb, but also to “build par” by buying discounted loans that will mature at par, further enhancing the potential for strong returns.

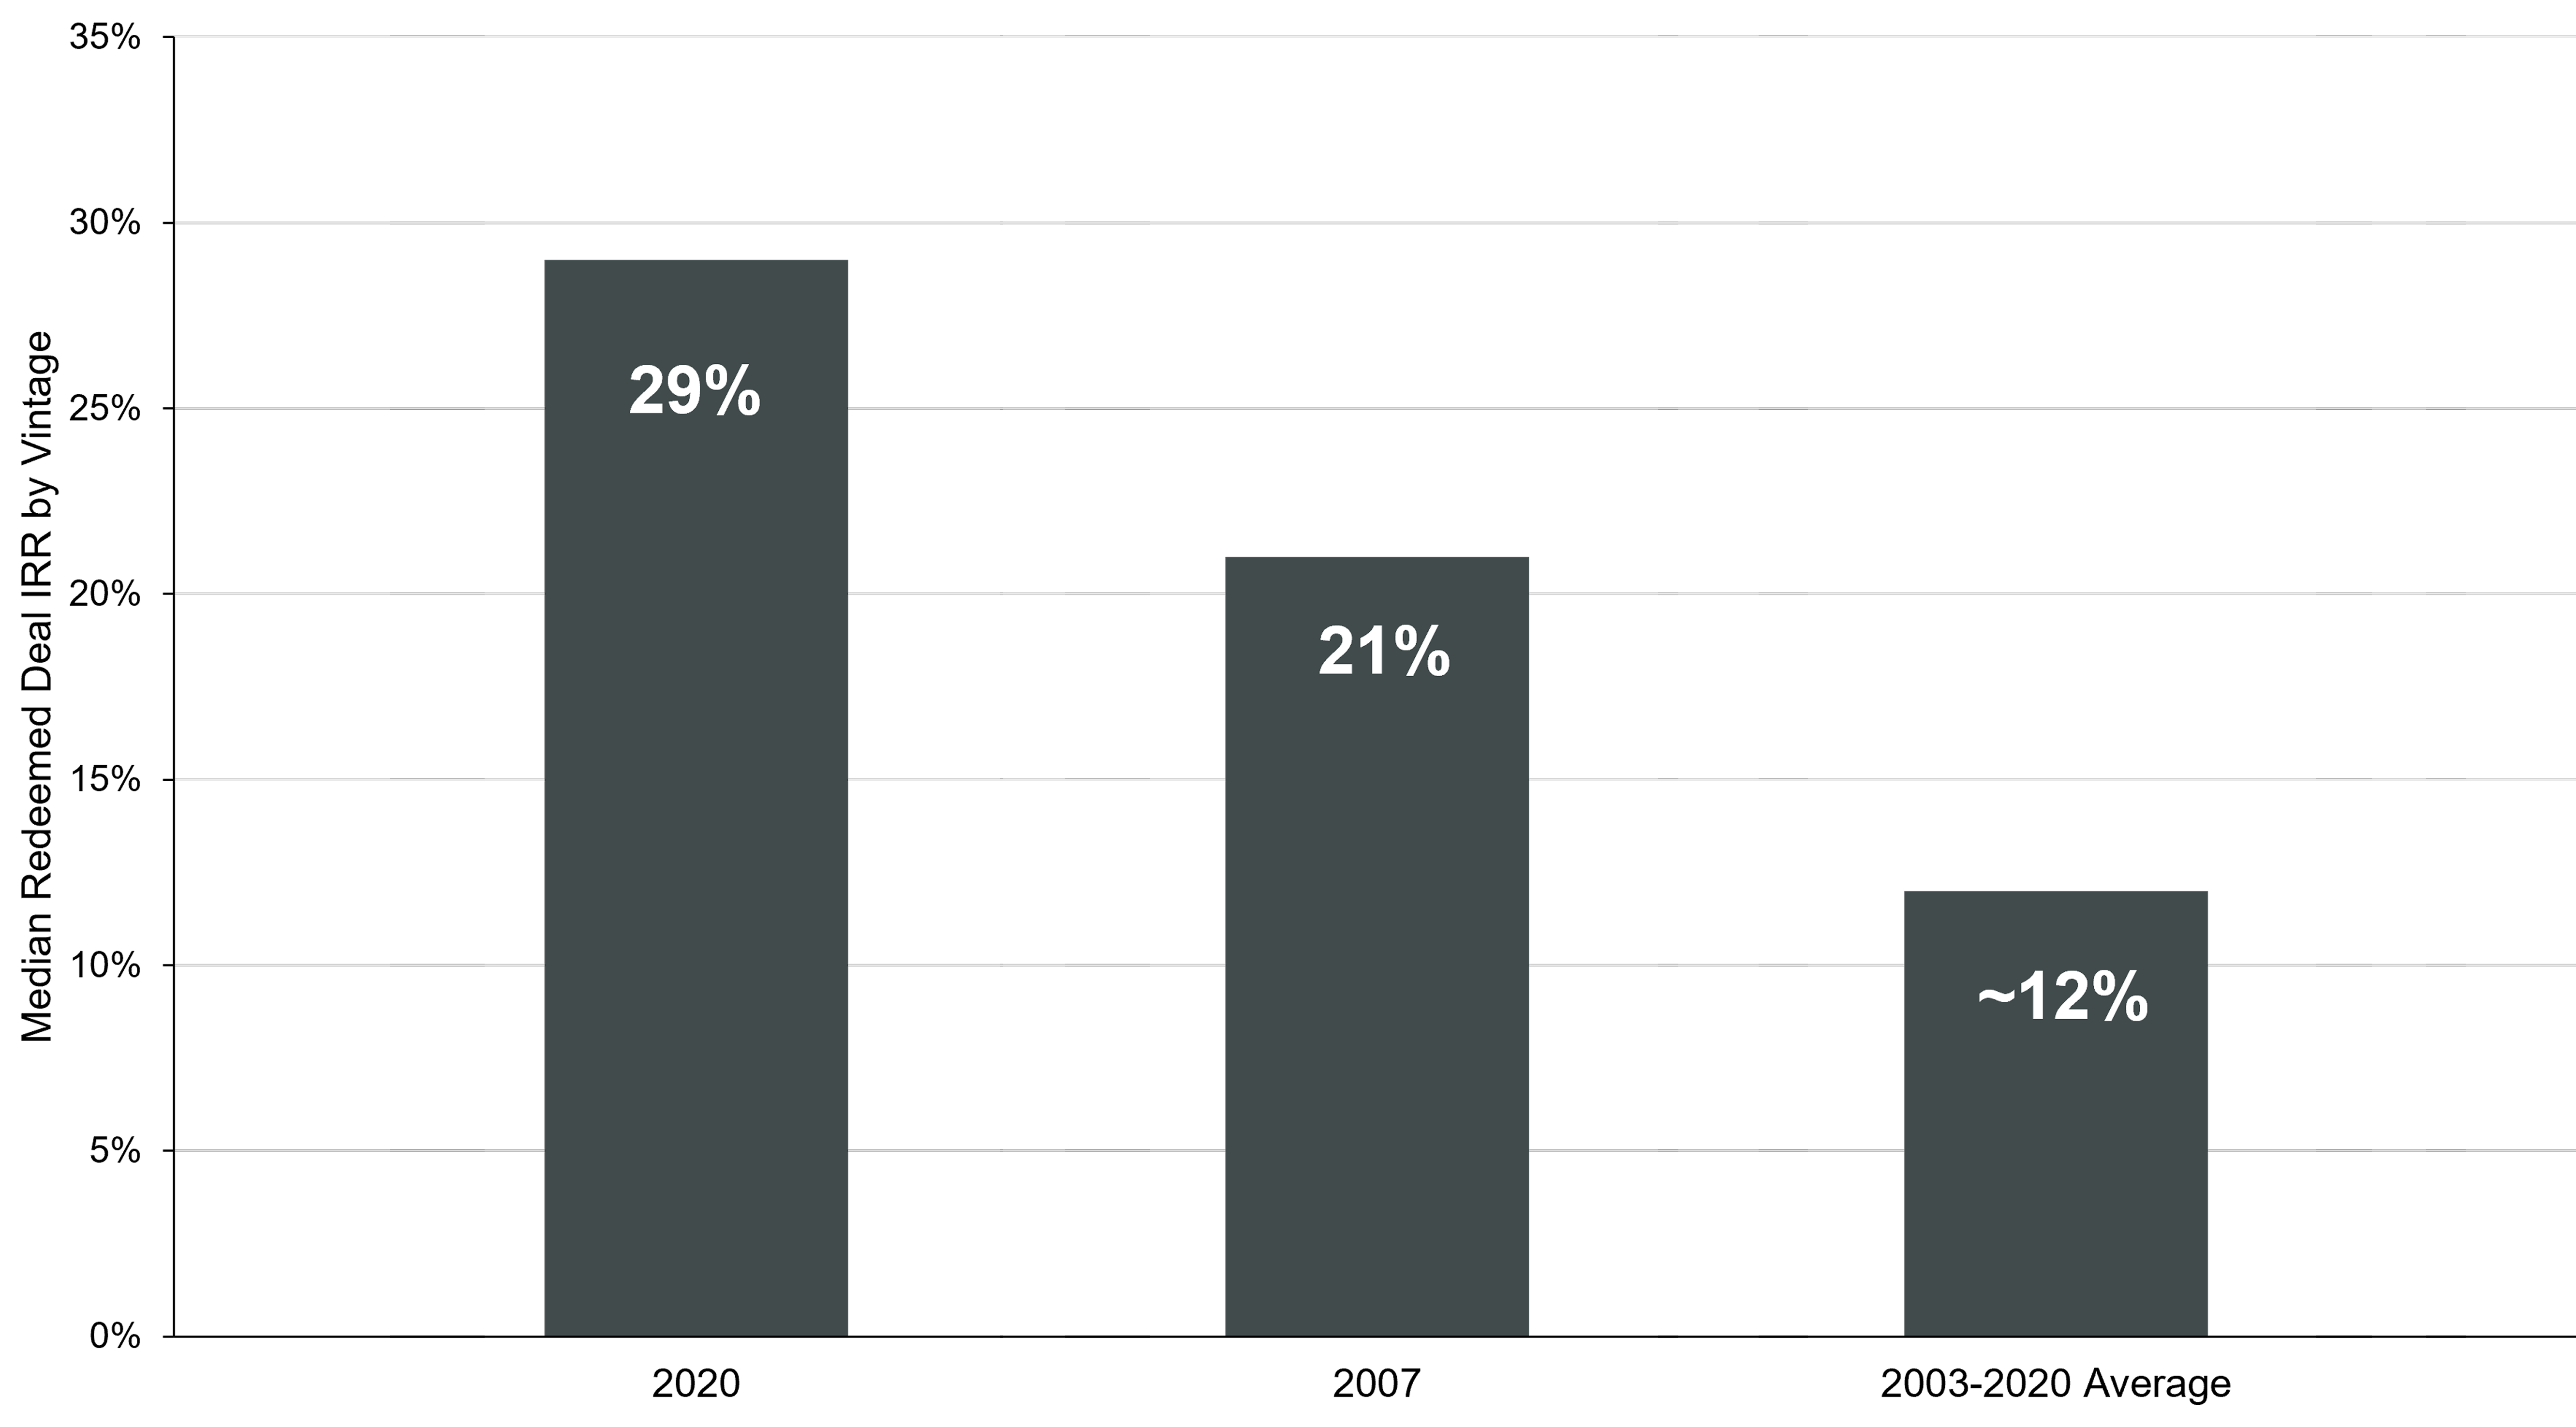
Below, we explore the two historical examples shown in Figure 2 that illustrate the active management of the liability and asset side of CLOs. While every cycle is different, we believe these illustrative examples highlight two of the main components of CLO equity performance— one case based on spread arbitrage and the other based on rapid changes in BSL collateral prices. They also illustrate that CLO equity has features that can make it resilient to many market stressors, especially for investors who can withstand changing market conditions and hold a tranche of CLO equity until the CLO is liquidated, reset, or refinanced.

Case 1: 2007 Vintage

In early 2007, CLO debt spreads were near all-time tights, which gave managers an opportunity to lock in a very low cost of capital for a multi-year period. During the financial crisis of 2008–2009, BSL prices fell significantly, spreads widened, and defaults increased. Despite mark-to-market volatility for equity investors, managers were able to reinvest early repayments (see Figure 4), maturities, and proceeds from active trading into discounted assets in the ensuing years that yielded significantly more than the manager’s low cost of capital. The result was a large distribution of excess yield for CLO equity investors who held throughout the period as the markets ultimately recovered.

It is important to note, however, that the pre-crisis vintage CLOs looked very different than the structures of today, with greater leverage and more lenient guidelines on risk-taking. While the CLO market has evolved significantly since the GFC, and current CLO deals are structured with greater levels of credit enhancement, a key advantage of the structure is the ability of a manager to lock in an attractive yield spread when the market sells off.

Figure 4. About a Quarter of the Bank Loan Market Repaid Loans Early Despite Volatility

Annual loan repayment rates in 2008 and 2009 

Bar chart showing Annual loan repayment rates in 2008 and 2009
Source: Pitchbook LCD. Data is based on annual loan repayment rates of 9% and 15% in 2008/2009. The historical data shown above are for illustrative purposes only and do not represent any specific portfolio managed by Lord Abbett or any particular investment. Indexes are unmanaged, do not reflect the deduction of fees or expenses, and are not available for direct investment. Past performance is not a reliable indicator or guarantee of future results.

Case 2: 2020 Vintage

Deals in the 2020 vintage of CLO equity, which have also produced above-average performance,3 were characterized by a brief but intense decline in loan prices that quickly recovered rather than an elongated period of higher spreads, as outlined in the case of 2007. In 2020, BSL prices fell from approximately $97 to ~$80 in a rapid turn of events as the threat of COVID-19 rattled markets.4 As we outline in Figure 5 below, BSL default rates and discounts to par tend to move in tandem. Even though spreads on the CLO liability side were widening during the market sell-off, resulting in a higher cost of capital for managers, the steep price discounts on loans were high enough to mitigate some of the impacts from wider liability spreads, as well as impacts from defaults and trading losses. In fact, many opportunistic managers took advantage of the volatility and launched vehicles into this dislocated market. Because of the pull-to-par effect as the market faced a V-shaped recovery, deals issued in 2020 that have since been redeemed displayed median IRRs of approximately 29% compared to the asset class’s historical-weighted average of approximately 12%.5

Figure 5. BSL Default Rates and Discounts Move in a Similar Pattern

Leveraged loan index last twelve-month default rate and price discount to par, 1999 to 2025

Line chart showing Leveraged loan index last twelve-month default rate and price discount to par, 1999 to 2025
Source: J.P. Morgan Research (default rates including distressed exchanges) and Pitchbook LCD (loan index discount to par). Data as of April 30, 2025. Loan discount to par data is based on the weighted average bid price of the Morningstar LSTA US Leveraged Loan Index. The historical data shown above are for illustrative purposes only and do not represent any specific portfolio managed by Lord Abbett or any particular investment. Indexes are unmanaged, do not reflect the deduction of fees or expenses, and are not available for direct investment. Past performance is not a reliable indicator or guarantee of future results.

Closing Thoughts

While CLO equity has structural advantages that have historically led to resiliency during market volatility, there is inherent credit risk in the underlying BSL collateral that makes security selection paramount. Every market cycle presents different obstacles, and performance dispersion can be fairly high depending on the environment. Because of that, we believe manager selection is critical for a CLO equity investor’s experience. We believe that managers who have strong leveraged credit platforms, experience investing in bank loans across multiple cycles, deep knowledge of the CLO structure and ecosystem, and extensive relationships in the credit markets are best positioned to succeed in this space.