We’ve written many times about the outperformance of active management over passive indexes in the fixed income space. This note will focus on exactly how managers can outperform, which approaches are repeatable and work consistently, and which require either exceptional manager selection foresight or fortuitous timing (two things that can be difficult to distinguish even after the fact).

First, what we know: active managers commonly beat indexes. One way to show this is to look at the frequency with which the Bloomberg U.S. Aggregate Bond Index (“Agg”) has underperformed the average active fund (defined as the 50th percentile) within each of the Morningstar U.S. Fund Intermediate Core Bond and Morningstar U.S. Fund Intermediate Core-Plus Bond categories. Based on 120 monthly observations (three-year rolling basis) over the period June 30, 2014–June 30, 2024, the Agg underperformed active core managers 70 times and active core-plus managers 86 times. That means that core managers beat the Agg nearly 60% of the time, while their core-plus counterparts outperformed over 70% of the time. (There is no assurance that this outperformance will continue in the future.)

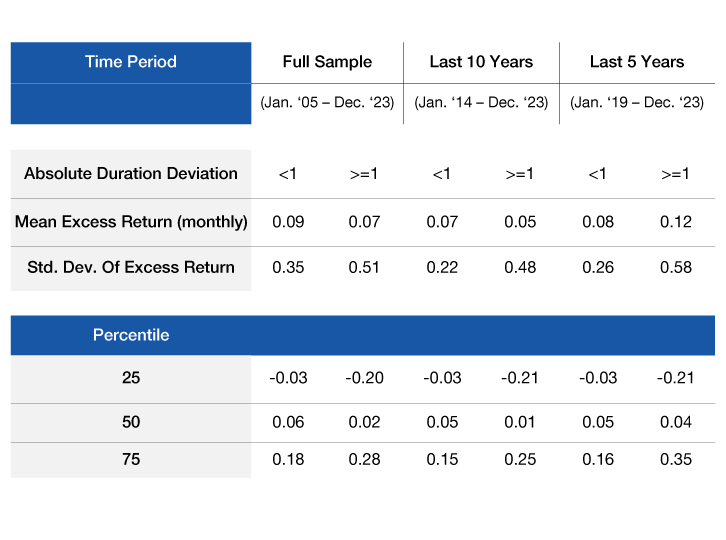
But active approaches can differ, leading to different results. Because there are two major drivers of risk in core fixed income, duration and credit, and in light of recent high-profile underperformance of large managers due to duration, we separated the return profiles of active managers in the Core category into those that have active duration positions of larger than one year (let’s call them “duration timers”) and those with positions less than one year. The impact of this categorization on subsequent monthly returns and the volatility of those returns are summarized in Figure 1 over three time periods: the full sample period going back to 2005, the last 10 years, and the last five years.

We find that, in most periods, the large duration bets did not lead to significantly larger monthly mean excess returns, and in no periods did the larger duration bets lead to higher median returns.  There is a significant positive skew to the results of the duration timers, as evident in the 75th percentile manager excess performance of over 25 basis points (bps) monthly, or over 3% annually, suggesting that skill may exist but unevenly benefits a subset of managers. Further, the penalty for incorrect bets is severe, as we’ve seen in the recent experience of those high-profile mangers. The bottom 25th percentile of duration timers costs around 20 bps per month in excess return loss, or over 2% annually, compared to a modest annual 0.4% excess return loss for the bottom quartile of the limited duration timing cohort.

Figure 1. Active Fixed-Income Managers: A Scorecard on Duration Timing

Excess returns for managers in the eVestment Core Fixed-Income Universe over the Bloomberg US Aggregate Bond Index by duration positioning for indicated periods

three charts
Source: eVestment Core Fixed-Income Category.
Past performance is not a reliable indicator or guarantee of future results
. The historical data are for illustrative purposes only, do not represent the performance of any specific portfolio managed by Lord Abbett or any particular investment, and are not intended to predict or depict future results. Investors may experience different results. Due to market volatility, the market may not perform in a similar manner in the future. Indexes are unmanaged, do not reflect the deduction of fees or expenses, and are not available for direct investment.

This volatility of excess returns due to duration timing raises the question: Is it worth it? The answer is not an unequivocal “no”. It is conceivable that an allocator views duration timing as an uncorrelated source of alpha, and has a long enough horizon, a diverse enough portfolio, and enough conviction in a manager to let that thesis play out over years and possibly decades. More commonly, we find manager evaluation to be fraught with information asymmetries and uncertainty, which become more acute as underperformance accrues. It’s not just a conviction issue either—a rational Bayesian framework of decision-making supports switching from an underperforming duration timer with the new out-of-sample data because it becomes more likely that the underperforming manager is in the low-skill cohort.

With all this hand wringing over the value of duration timing, we need to point out that there is another way. The managers with modest active duration positions have median outperformance above the duration timers and accomplish this with much less dispersion among managers. It is clear to us from this data set and from experience that duration timing can be a source of alpha, but it should be sized appropriately alongside other repeatable sources of alpha.

A breadth of sources of alpha helps moderate volatility of excess returns, making it much easier for asset allocators to sort managers into skilled or unskilled cohorts. This is the essence of the Fundamental Law of Active Management, or Grinold’s Law, which decomposes information ratio into a skill coefficient and the breadth of application of that skill.1 A favorite analogy for this is a casino which, of course, has an edge in all games. The highest-value method of applying that edge is in repeated small instances—think millions of $100 bets—rather than large infrequent instances, which could bankrupt the house after a string of bad luck or a run-in with a particularly skilled gambler.

The sources of edge for a skilled active manager are many. Credit exposure wins over time by providing higher spreads than losses from default in nearly every corner of the credit world, but especially in a few less efficient corners of the market like securitized products, shorter duration credits, off-the-run issues, and bonds that exist around the cusp of investment grade and high yield. Figure 2 shows the spread of corporate credit over historical defaults and the mean-reverting nature of those spreads, which lends itself to an active approach of overweighting credit when spreads are wide and underweighting when spreads are narrow. 

Figure 2. Credit Has Been a Consistent Driver of Excess Returns

Credit spreads versus credit losses, by rating, for the years 1997–2022

line chart
Line Chart
four boxes with excess returns
Source: Moody’s and Bloomberg Index Services. Excess returns data is for the Corporate and ABS components of the Bloomberg US Aggregate Bond Index for the 20 years ended December 31, 2023. OAS=Option-adjusted spread. Bps=Basis points; one basis point equals one one-hundredth of a percentage point. Spread and loss data as of December 31, 2022. Most recent data available. Subject to change based on changes in the market.
Past performance is not a reliable indicator or guarantee of future results. The historical data are for illustrative purposes only, do not represent the performance of any specific portfolio managed by Lord Abbett or any particular investment, and are not intended to predict or depict future results. Investors may experience different results. Due to market volatility, the market may not perform in a similar manner in the future. Indexes are unmanaged, do not reflect the deduction of fees or expenses, and are not available for direct investment.

Outside of credit, factor tilts such as value, size, quality, and momentum all have shown excess returns relative to size-weighted benchmarks in fixed income.2 New issue discounts and liquidity provision through bid-ask spread differentials are other reliable and repeatable sources of excess return. Finally, as shown in Figure 3, additional spread is available for managers able to navigate the securitized space as many fixed-income participants lack the resources or mandate to do so.

Figure 3. Two Potential Benefits of Securitized Sectors (CLO & ABS)

1. Carry: Attractive spread advantage over investment-grade corporates

chart with spreads

2. Quality: Structure provides protection from defaults

chart with default rates
Source: Barclays (top panel), S&P Global (bottom panel). Corporates=Corporate bonds. CLO=Collateralized loan obligations. ABS=Asset-backed securities. Spread data as of June 30, 2024. Default rates based on one-year average defaults over the following periods studied: corporates, 1980-2023; ABS, 1983-2023; CLO, 1997-2023. Bps=Basis points; one basis point equals one one-hundredth of a percentage point. Most recent data available.
Past performance is not a reliable indicator or guarantee of future results. The historical data are for illustrative purposes only, do not represent the performance of any specific portfolio managed by Lord Abbett or any particular investment, and are not intended to predict or depict future results. Investors may experience different results. Due to market volatility, the market may not perform in a similar manner in the future. Indexes are unmanaged, do not reflect the deduction of fees or expenses, and are not available for direct investment.

We believe credit can provide the breadth necessary to translate active skill into consistent results. Figure 4 shows the relative volatility of investment-grade credit spreads and interest rates. Rates have been volatile, but it’s the lack of breadth in independent decisions in rates that makes active rate-positioning so binary and volatile in its effect on portfolios. Key rate positioning can provide some breadth, but generally, a participant gets the rate call right or wrong and can only position a few times a year, at most.

Contrast that to credit positioning, where there are many different dimensions. In credit, a manager can express views on, among other things: the health of the consumer; conditions in the commercial real estate market; the merits of different sectors of corporate bonds; the steepness of credit curves over quality, time, or registration type; and overall market liquidity. The list of possible and unrelated dimensions in credit is massive. This allows a skilled manager to have hundreds if not thousands of chances every year to demonstrate that skill, leading to much more consistent outcomes than big bets on rates.

Figure 4. Rate Volatility Is Typically Much Higher than Spread Volatility

Treasury yield volatility versus credit spread volatility, 2001-2023

bar chart
Source: Bloomberg. Data represents volatility of investment-grade (IG) corporate bond spreads and U.S. Treasury bond yields. Bps=Basis points; one basis point equals one one-hundredth of a percentage point.
Past performance is not a reliable indicator or guarantee of future results. The historical data are for illustrative purposes only, do not represent the performance of any specific portfolio managed by Lord Abbett or any particular investment, and are not intended to predict or depict future results. Investors may experience different results. Due to market volatility, the market may not perform in a similar manner in the future. Indexes are unmanaged, do not reflect the deduction of fees or expenses, and are not available for direct investment.

Conclusion

While we strongly believe active management is a dominant approach in fixed income, different manager approaches can lead to widely different outcomes. We find a diversified approach to alpha generation across rates and credit sectors leads to more predictable results.