Finding Opportunity in Credit
Credit Offers Sources of Higher Yield Than Core Bonds
Yields by asset class
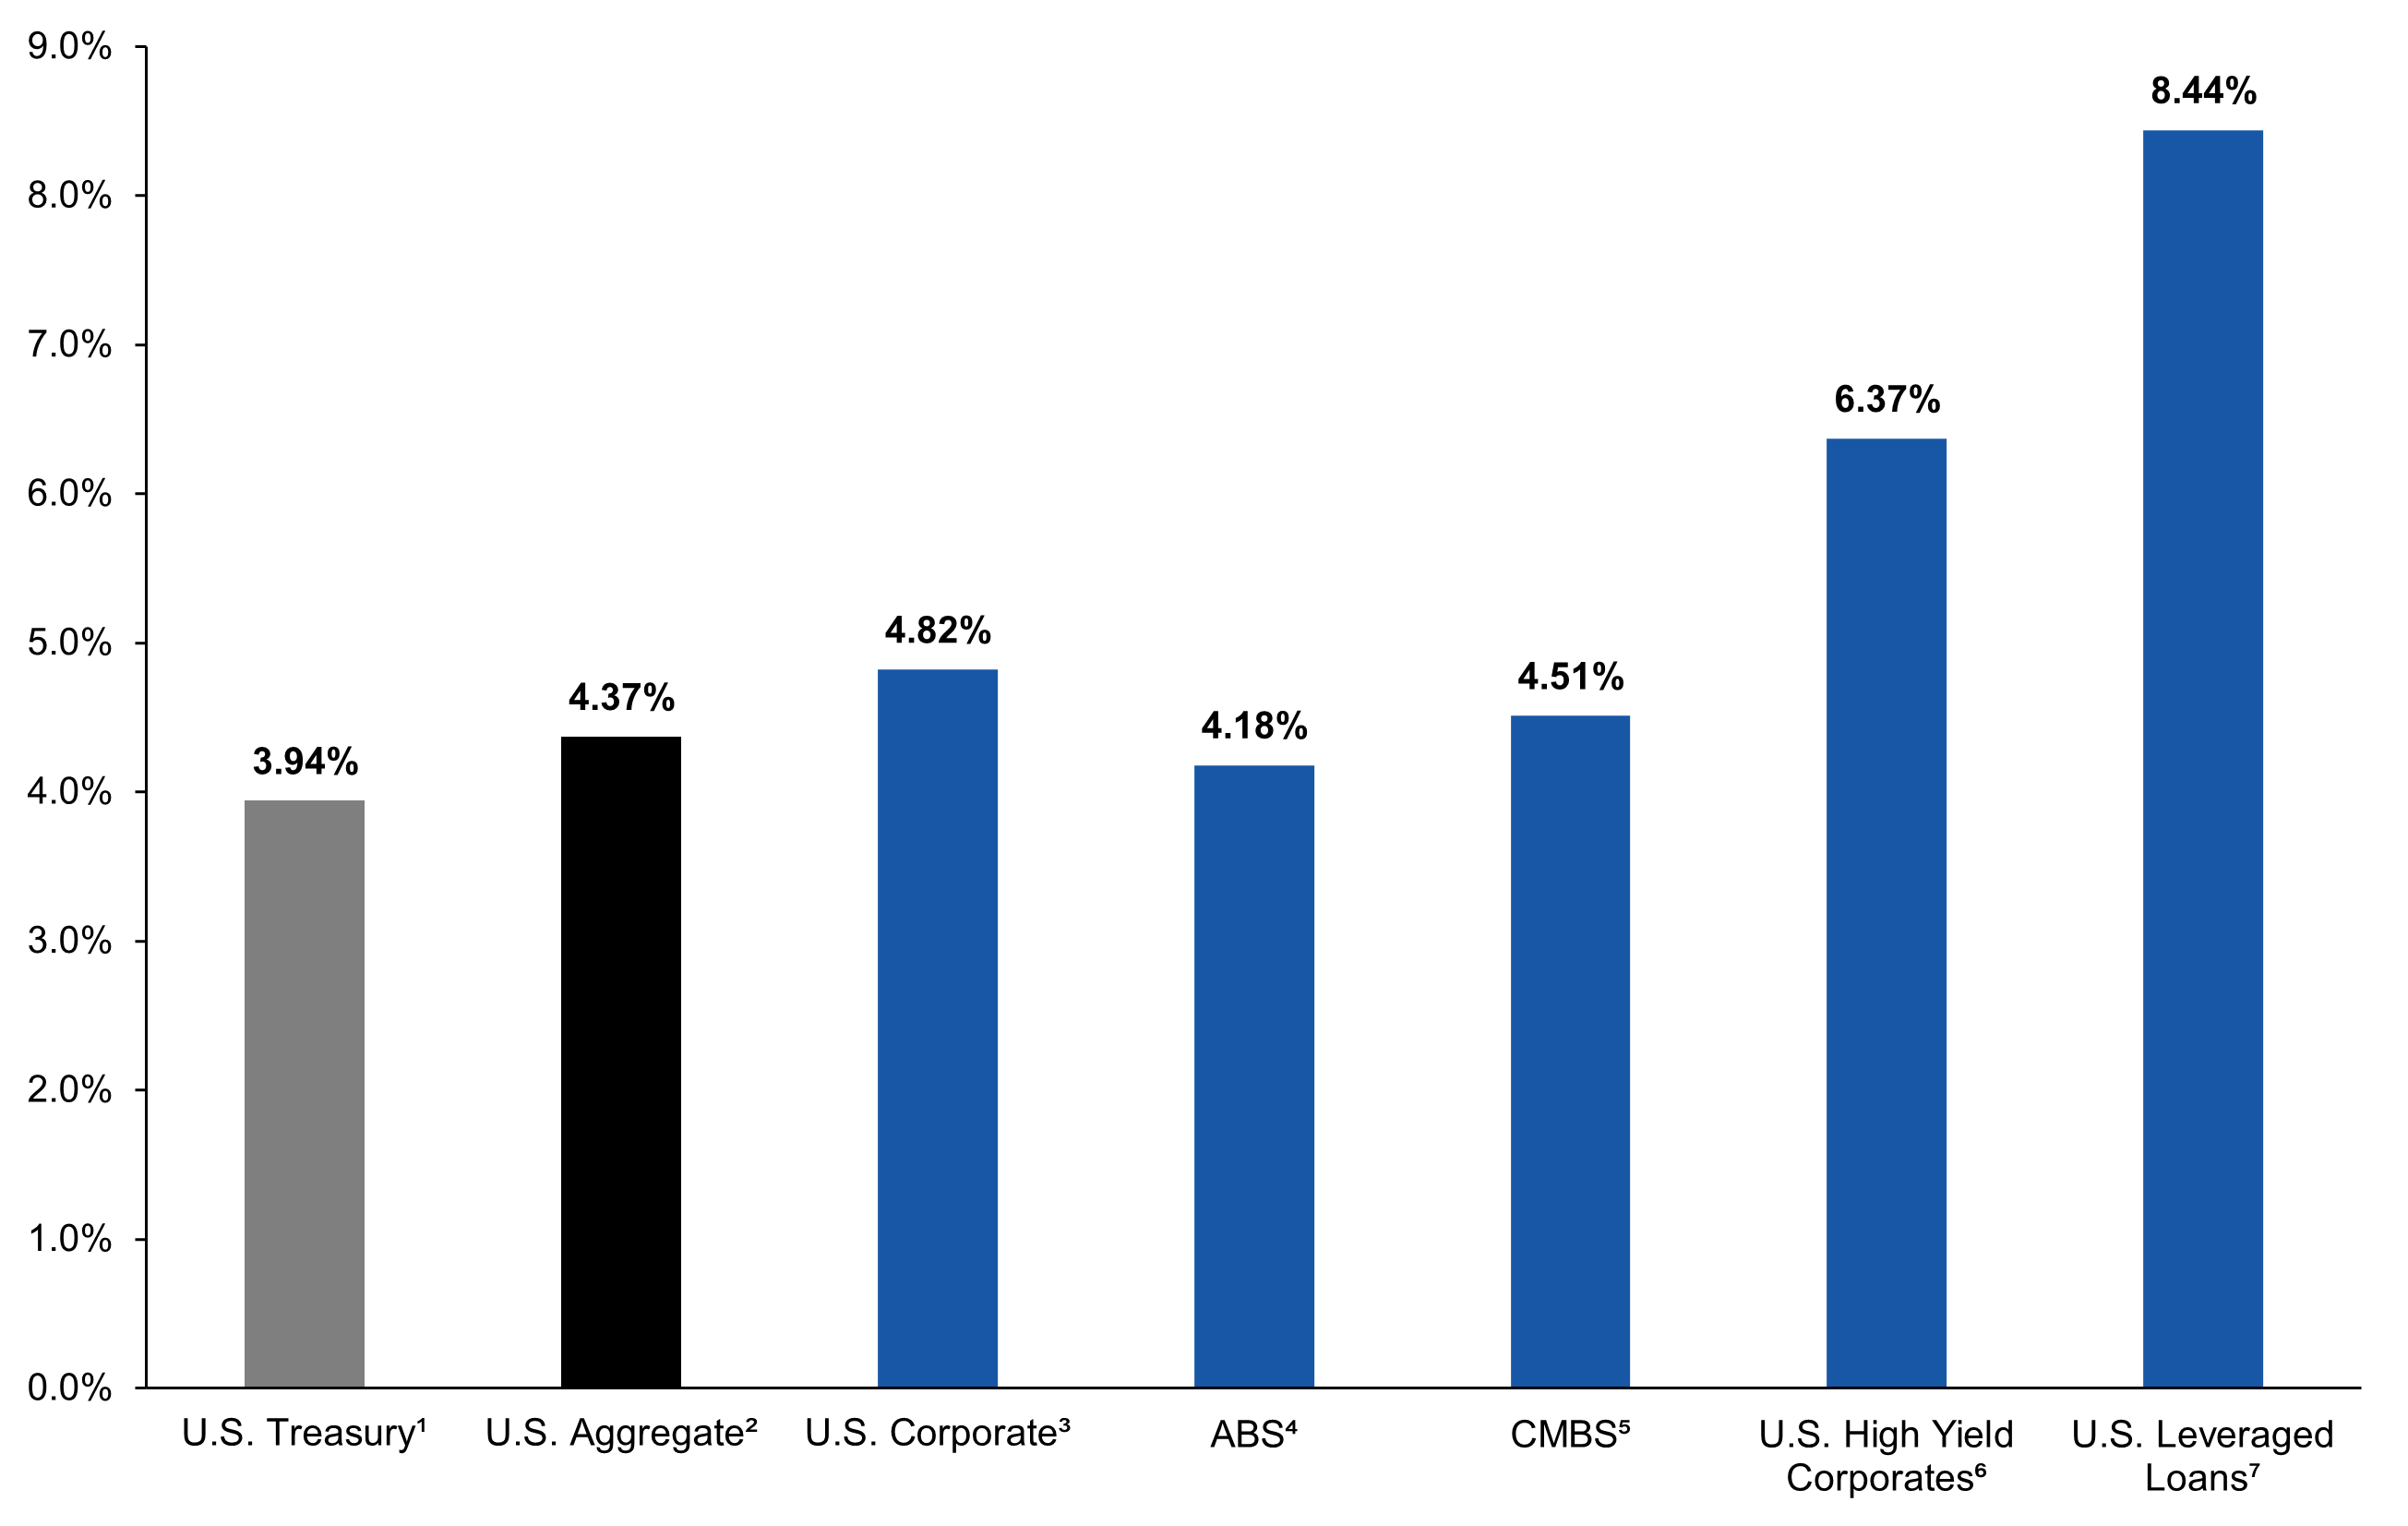
Data as of 09/30/25. ¹Bloomberg U.S. Government Index. ²Bloomberg U.S. Aggregate Index. 3Bloomberg U.S. Investment Grade Corporate Index. 4Three subsectors of the U.S. Aggregate Index: credit/charge card, auto, and utility receivables. 5 Bloomberg CMBS Index. 6 ICE BofA U.S. High Yield Index. 7Morningstar LSTA US Leveraged Loan Index. Past performance is not a reliable indicator or guarantee of future results. For illustrative purposes only and does not represent any specific portfolio managed by Lord Abbett or any particular investment. Indexes are unmanaged, do not reflect the deduction of fees or expenses, and are not available for direct investment.
Elevated Yields May Present an Attractive Entry Point
Index Yields have rarely been above 8.0% since the Global Financial Crisis
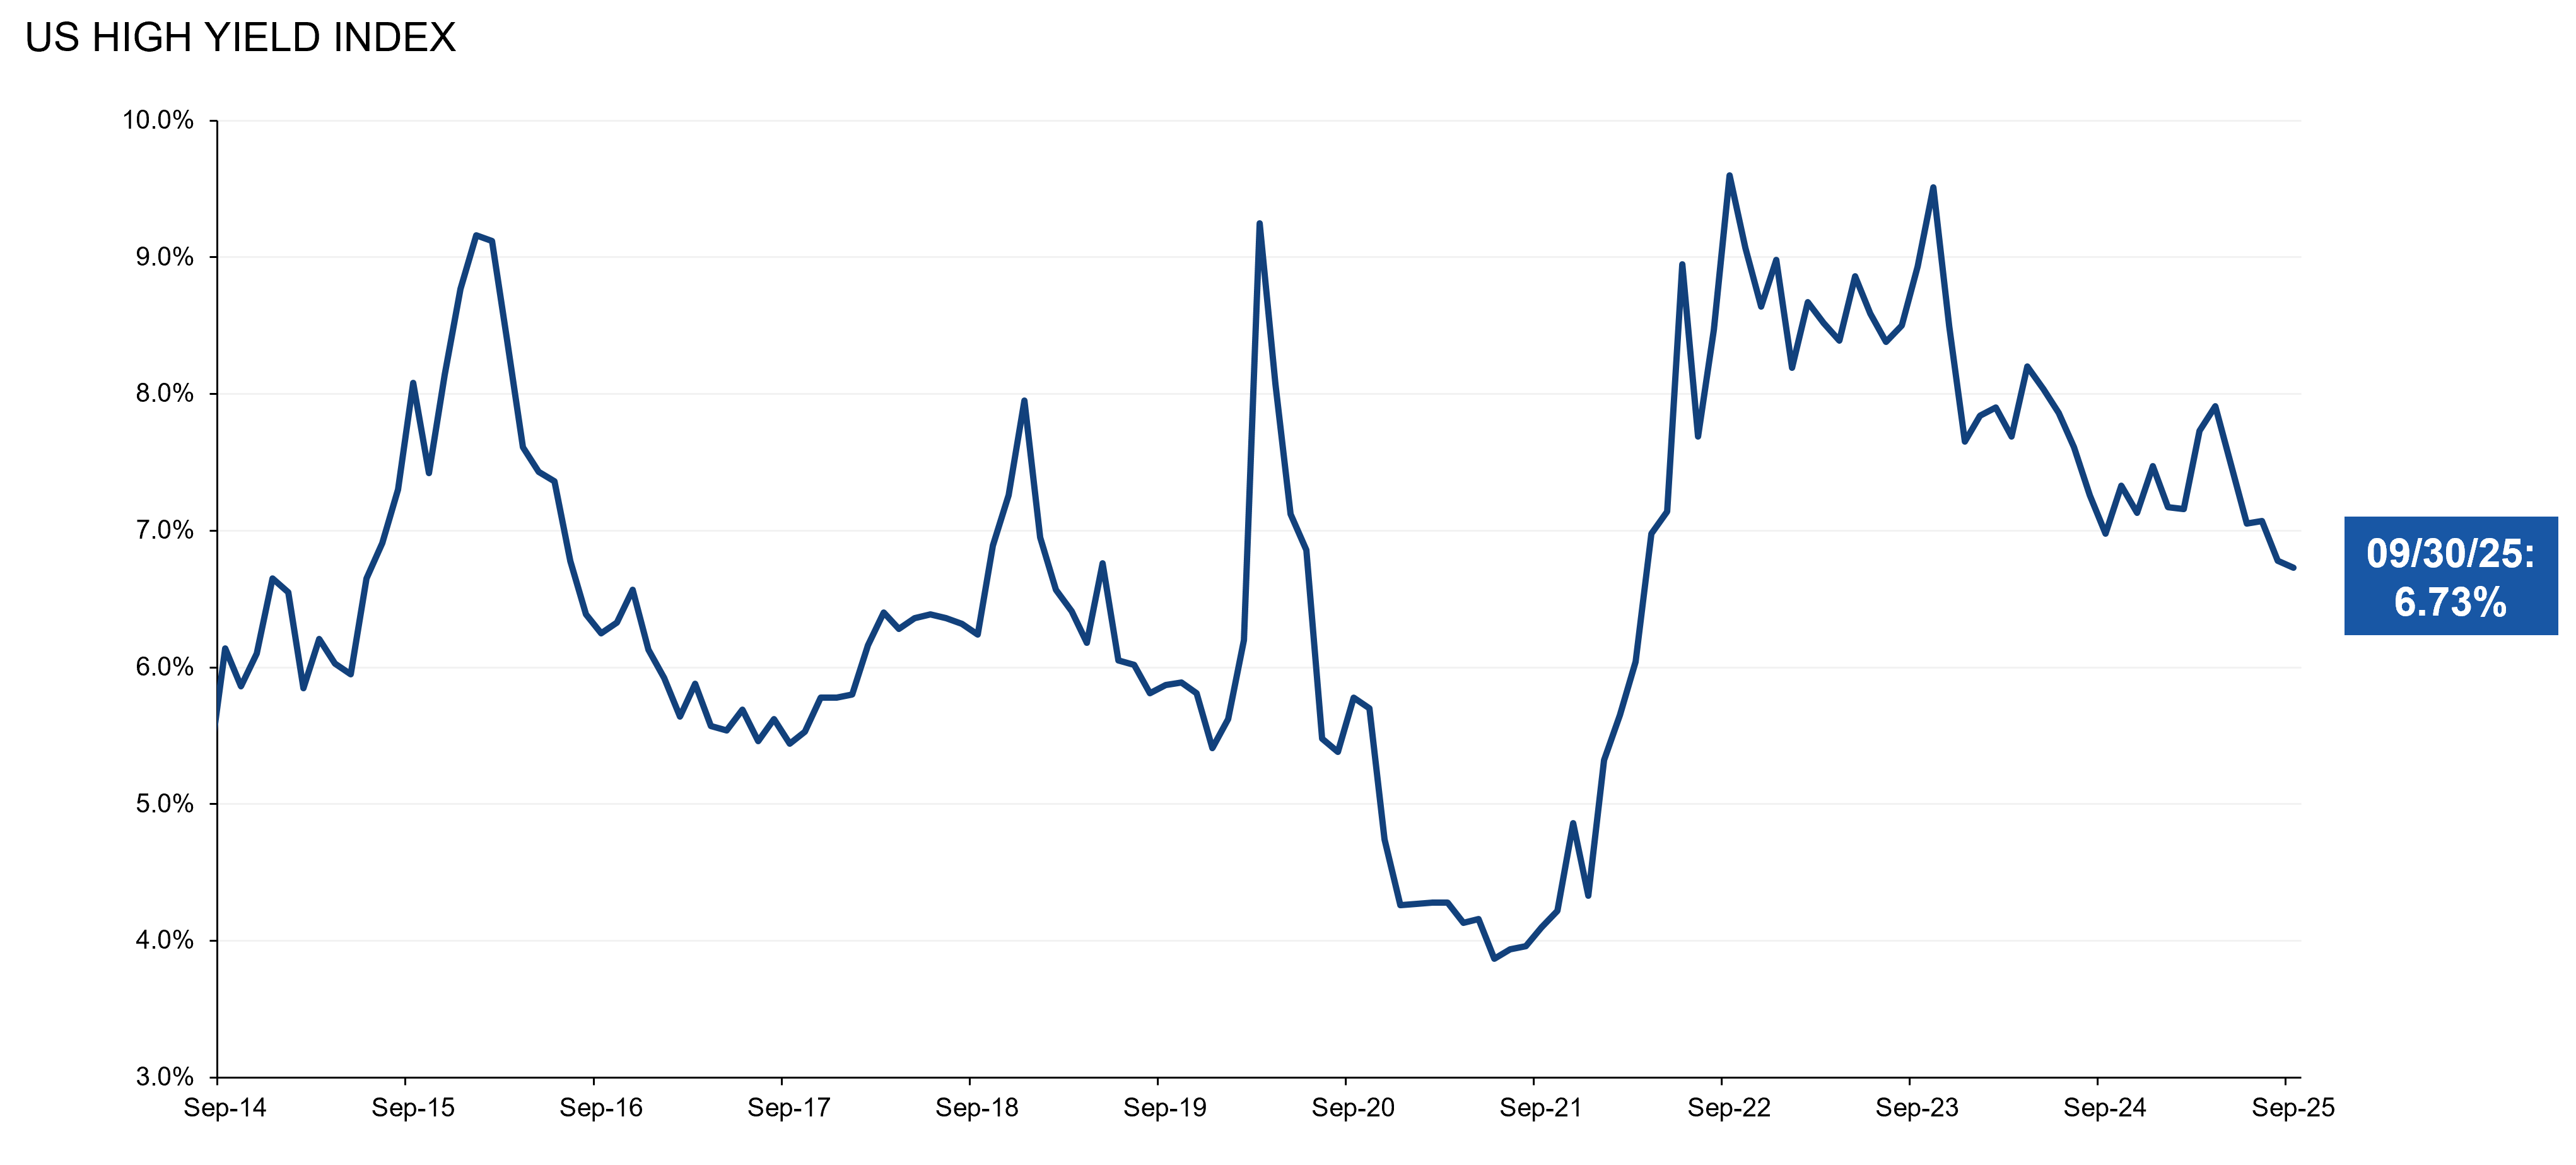
Data as of 09/30/25. Source: ICE Data Indices, LLC. Yields represented by the U.S. High Yield Constrained Index. * Return data calculated from index inception in December 1997. Past performance is not a reliable indicator or guarantee of future results. It is important to note that the high-yield market may not perform in a similar manner under similar conditions in the future. The historical data shown in the chart above are for illustrative purposes only and do not represent any specific portfolio managed by Lord Abbett or any particular investment. Indexes are unmanaged, do not reflect the deduction of fees or expenses, and are not available for direct investment.