Equity markets faced challenges in the early part of the year, as global trade and tariff uncertainty created headwinds that were stronger than the expected tailwinds from more supportive U.S. fiscal and monetary policy. But investors have shaken off concerns over tariffs and the economy to bid stocks higher. Here, we focus on three key factors supporting equities in the current market.

1.    Earnings Remain Strong

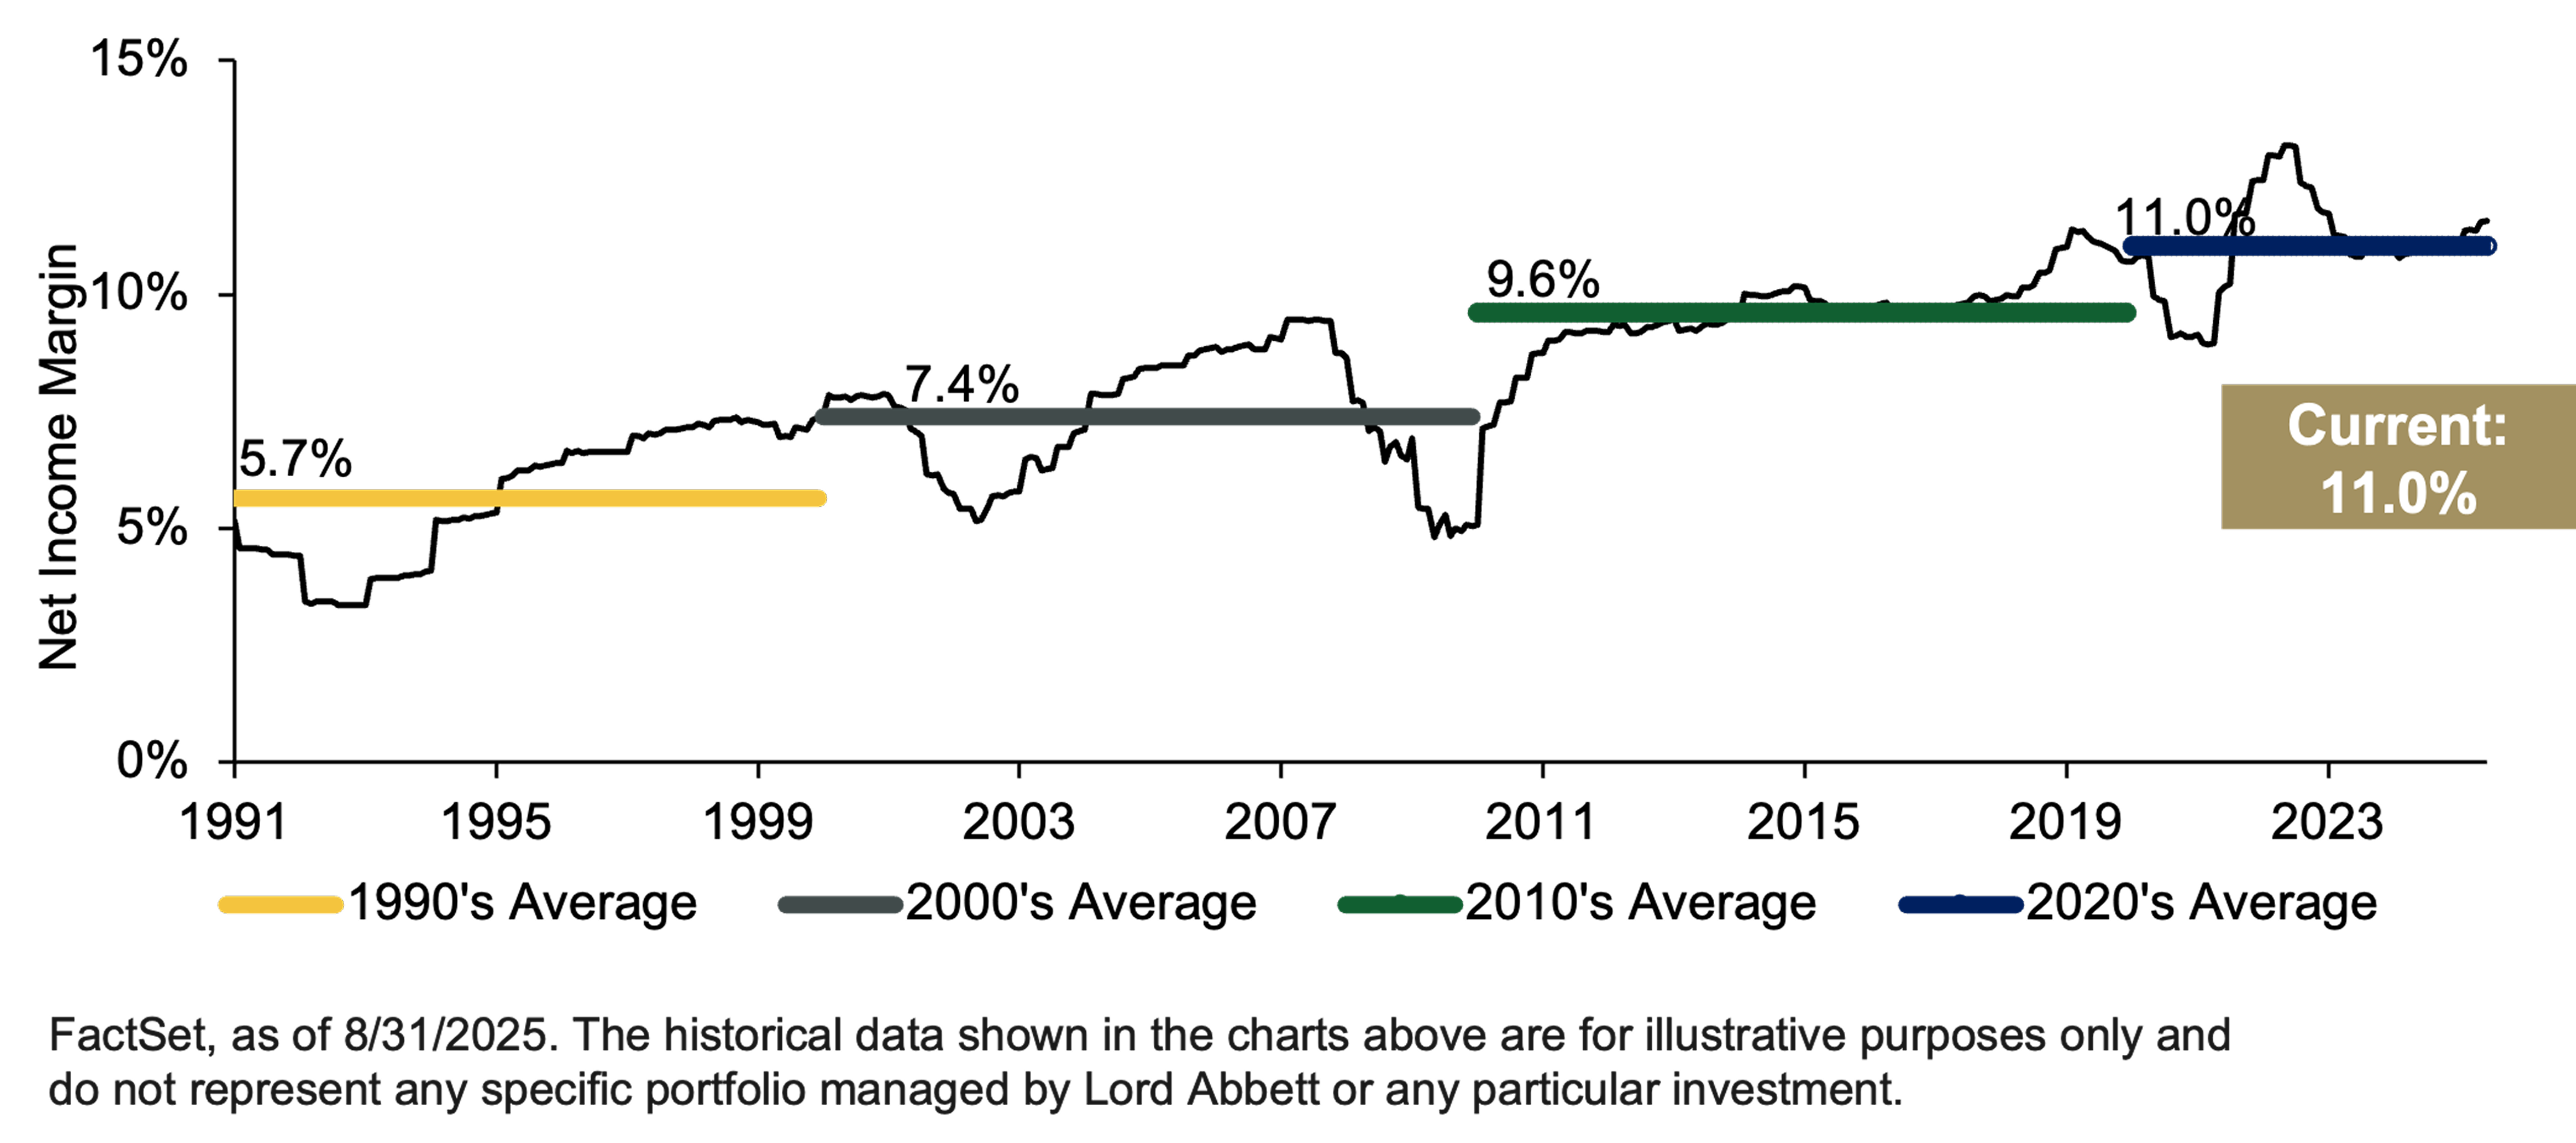
The equity markets have shown some resilience as first- and second-quarter earnings for the S&P 500® Index beat expectations by a wide margin. (See Figure 1.) Earnings growth for the rest of the year, and for 2026, is expected to be in double digits. 

Figure 1. After Upside Surprises, Earnings Strength Is Expected to Continue

Reported and forecast earnings for the S&P 500 Index for the indicated periods

Bar Chart Showing Reported and forecast earnings for the S&P 500 Index for the indicated periods
Source: FactSet. Data as of 8/31/2025. Diamonds represent earnings estimates at the beginning of each bar’s respective quarter.
Past performance is not a reliable indicator or guarantee of future results. The historical data shown in the chart above are for illustrative purposes only and do not represent any specific portfolio managed by Lord Abbett.

Amid the challenges posed by tariff uncertainty and the prospect of slowing U.S. economic growth, the robust earnings picture provides an encouraging sign of resilience.

2.    Valuations Need to Be Seen in Context

Based on forward price-to-earnings (P/E) ratios, stocks are more expensive than they have been on average over the last 40 years. The average forward P/E for the S&P 500 over the last 40 years is 16.7x. The market is currently trading at roughly 23x. But we think a few points merit consideration here. We believe the companies dominating the market now are better equipped to generate consistent earnings growth and deliver value to shareholders. Forty years ago, the net income margin of the S&P 500 was below 6%; now, companies on average are earning over 11% (see Figure 2). Free-cash-flow margins were below 5% in the mid-1980s; now, they are over 11%. The amount of money that companies returned to shareholders in the form of dividends and buybacks was 25% as a percentage of return on equity; now, it’s 70%. 

Figure 2. S&P 500 Profitability Is at an All-Time High

Net income margin for the S&P 500 Index (monthly), January 1, 1991–August 31, 2025

Chart Showing Net income margin for the S&P 500 Index (monthly), January 1, 1991–August 31, 2025
Source: FactSet. Data as of 8/31/2025. Net income margin is a financial ratio used to calculate the percentage of profit a company produces from its total revenue, measuring the amount of net profit a company obtains per dollar of revenue gained.
Past performance is not a reliable indicator or guarantee of future results. The historical data shown in the chart above are for illustrative purposes only and do not represent any specific portfolio managed by Lord Abbett.

Why is this the case? Company structures have changed drastically over the past 40 years. Back then, the companies leading the market were economically cyclical—think manufacturing and utilities. Now, innovation—think technology and communications—makes up a much larger percentage of the market capitalization of the S&P 500. These companies have leaner balance sheets and more efficient business models, which make them more profitable. This is all to say that we think the market is more expensive because companies are better at generating profits and creating value.

3.    The Rally May Have More Room to Run

With equity markets near all-time highs, many investors are wondering if the current rally has run its course, and if it is time to lower their equity exposure and look for other options. If we look at the current bull market compared to previous advances, we can see that the duration of, and returns from, the recent bull run are near historical averages—but remain well below those of previous advances. 

Figure 3. Size and Duration of Current Bull Run Relative to Other Rallies Suggest Possibility of Additional Upside

S&P 500 bull market cycles since 1928

Chart and Scatter Plot Showing S&P 500 bull market cycles since 1928
Source: Oppenheimer & Co. and FactSet. Data as of 08/31/2025. Past performance is not a reliable indicator or guarantee of future results. For illustrative purposes only.

Summing Up

As we have noted elsewhere, the key factors supporting the equity market remain positive. While risks exist, it is essential to keep the big picture in mind. Global economic growth is solid, driven by booming secular forces like generative artificial intelligence (AI), leading to resilient growth in corporate earnings. These powerful forces dominate market performance in the long run. We are also focused on quality stocks—those with long-term histories of robust earnings and steady dividend growth. We are also seeing potentially attractive opportunities in equity markets outside the United States, as the economic backdrop improves in many regions.