Note: This is an update of an article originally published in November 2024.

Buy low and sell high! This strategy has been preached since the beginning of investing. The thinking behind this maxim: When the equity market is expensive, investors should sell their winners and capture some of their hard-earned gains. When stocks are seen as cheap, often after a market downdraft, investors should increase their equity exposure and position themselves for future appreciation.

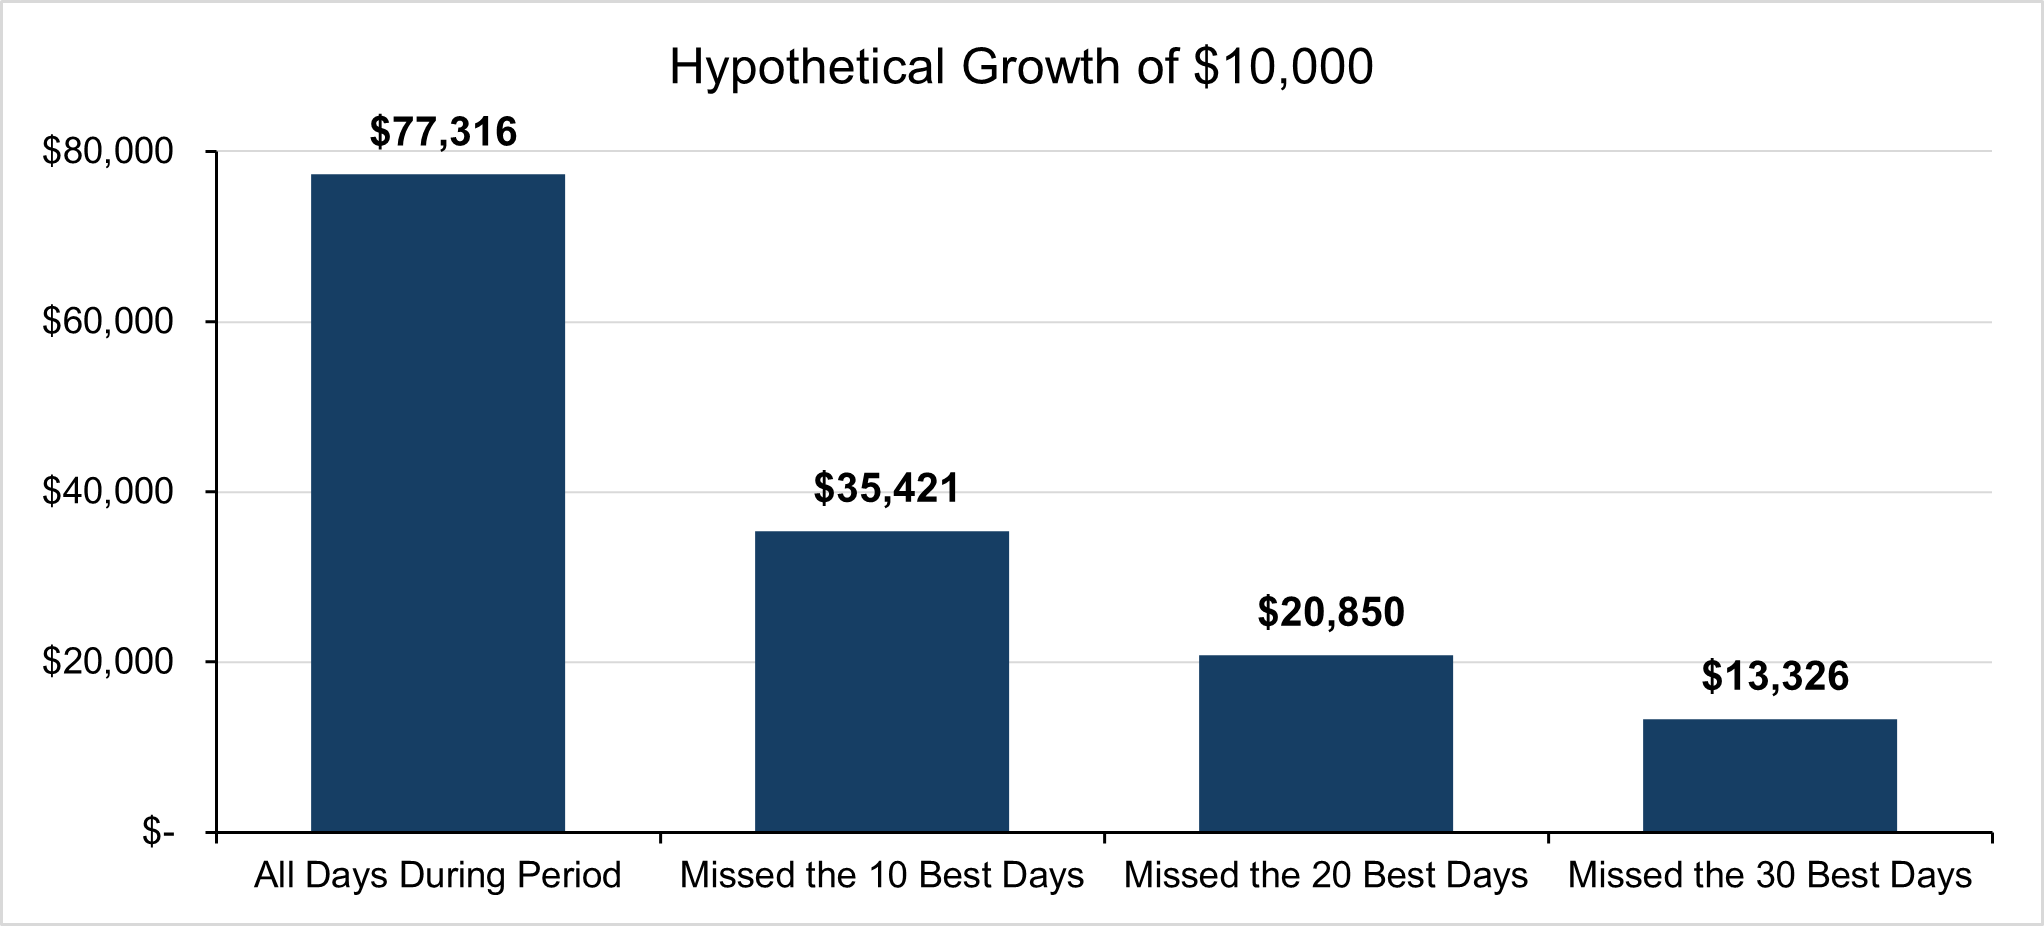
This approach is simple conceptually, yet it is much more complicated to execute in practice. Peaks and troughs are not necessarily foreseeable, and it is difficult to determine the duration of upward or downward moves in the equity market. This is why history has shown that those who stay invested, or those who invest at regular intervals, have had much better outcomes than those who tried to time the market.

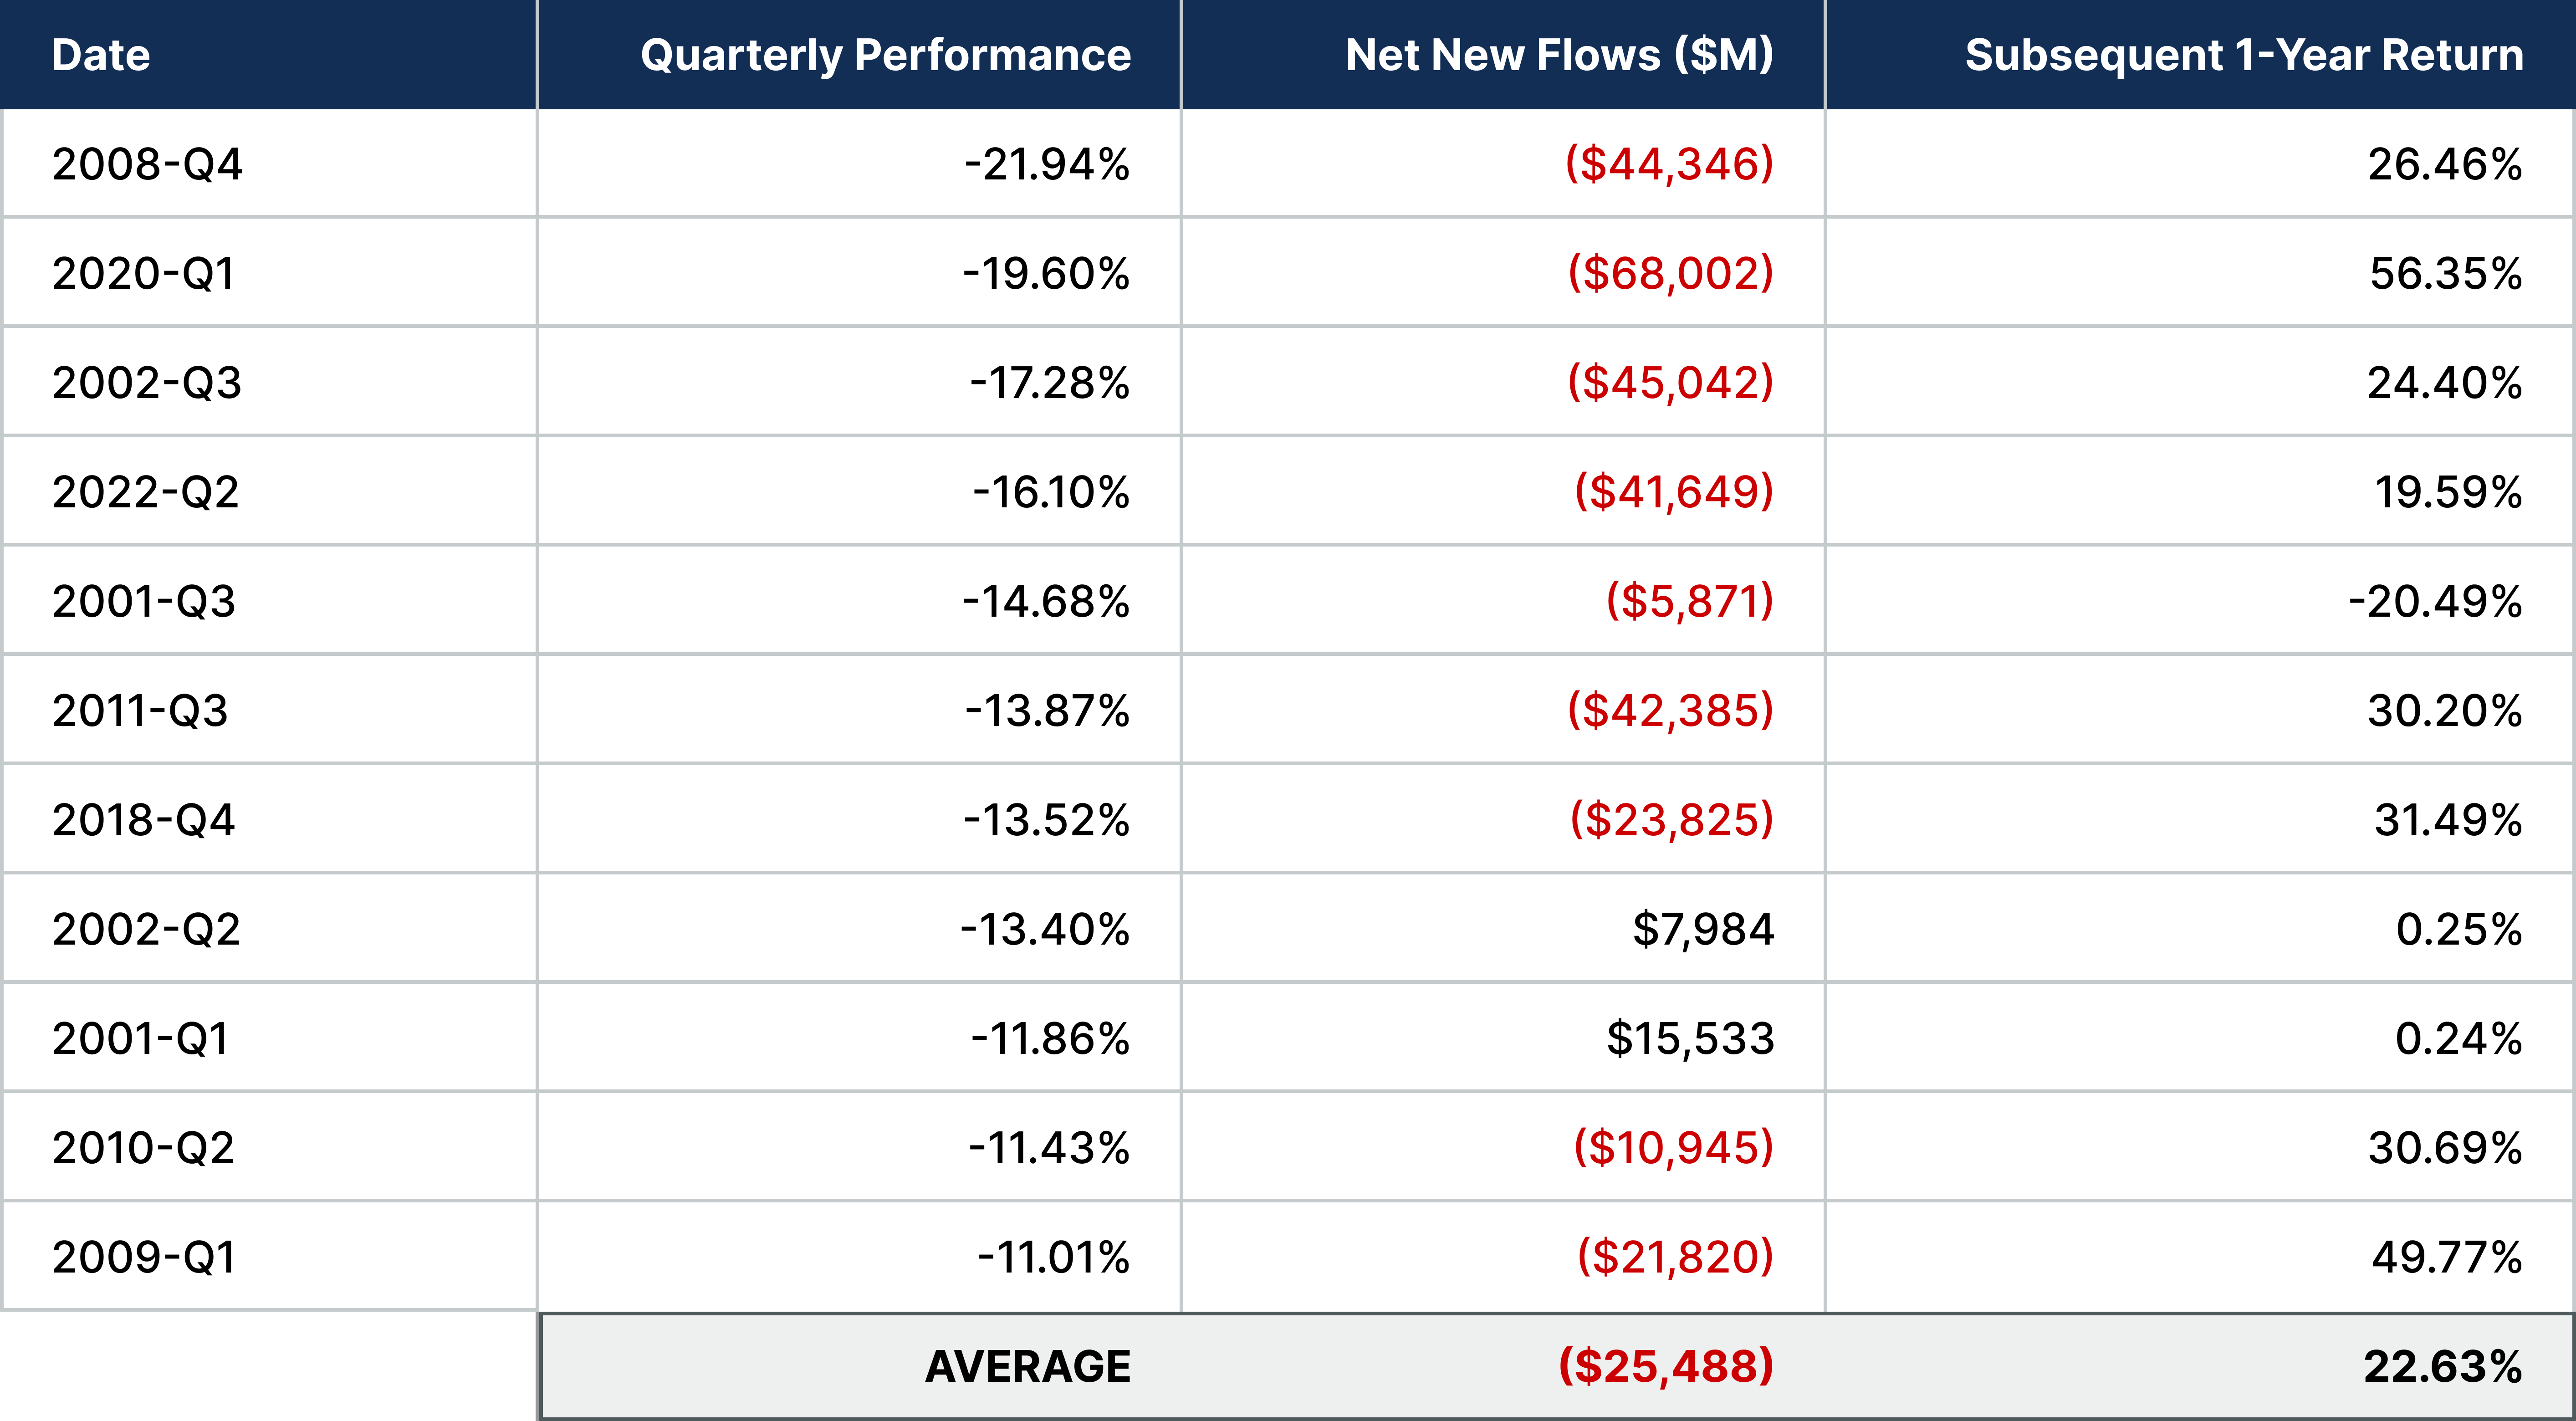
Despite this evidence, investor behavior still shows a reluctance to stay invested in equity markets after periods of weak returns. Over the last 25 years, whenever major U.S. stock indexes had a double-digit drawdown over a quarter, it was common to see net outflows in the equity markets. In almost every instance, the market rebounded strongly over the following 12 months, meaning that some investors inverted the old cliché and “sold low,” missing out on that recovery (Figure 1). 

Figure 1. Investors Exiting the Market During Drawdowns Have Missed Out on Major Recoveries

Data for the S&P 500® Index for the indicated periods

Data from the S&P 500® Index Showing that Investors Exiting the Market During Drawdowns Have Missed Out on Major Recoveries
Source: Morningstar. Performance based on total return of S&P 500® Index in the periods following quarterly declines of 10% or more since Q4 2008.
Past performance is not a reliable indicator or guarantee of future results. For illustrative purposes only and does not represent any specific portfolio managed by Lord Abbett or any particular investment. Indexes are unmanaged, do not reflect the deduction of fees and expenses, and are not available for direct investment.

Why Staying Invested Matters

The goal of investing is long-term wealth creation. This wealth creation is highlighted by two distinct phases. The first phase is wealth accumulation. Historically speaking, equities have been one of the most compelling asset classes to help build long-term wealth. While the percentage of one’s allocation to equities depends on their own time horizon and goals, we believe it is imperative to be steadfast in whatever that equity allocation is supposed to be. If we look at the last 25 years, missing the best 10, 20, or 30 days in the market had a profound impact on an investor’s portfolio (Figure 2). For example, if you missed the 10 best-performing days in the U.S. equity market, you would have a portfolio less than half the size of someone who remained fully invested in equities.

Figure 2. Equity Investors Who Stayed the Course Have Benefited the Most

Hypothetical growth of a $10,000 investment in the S&P 500® Index from January 1, 1998, to December 31, 2024

Bar Chart Showing Hypothetical growth of a $10,000 investment in the S&P 500® Index from January 1, 1998, to December 31, 2024
Source: Standard & Poor’s and Lord Abbett. Returns are measured based on the S&P 500® Index from January 1, 1998, to December 31, 2024.
Past performance is not a reliable indicator or guarantee of future results. Data does not represent current market data but is included as an illustration of the historical effect on investment returns of market participation in varying periods, via mathematical calculations of equity returns for the S&P 500 Index. The analysis contained herein does not constitute a personal recommendation or investment advice and should not be used as the basis for any investment decision. For illustrative purposes only and does not represent any specific portfolio managed by Lord Abbett or any particular investment. Indexes are unmanaged, do not reflect the deduction of fees and expenses, and are not available for direct investment.

If we are focused on long-term wealth creation, then we should measure returns over longer periods than a few days, one quarter, or even one year. Looking at annual returns of the S&P 500® Index since 1926, we can see that returns have been positive almost 74% of the time (Figure 3). Over five-year rolling periods, this increases to 88%. Over 10-year periods, returns were positive 94% of the time. This further demonstrates the impact of remaining invested in equities through full market cycles; it has been rare to experience losses when measuring returns through such a long-term lens.

Figure 3. Through the Decades, Staying in the Market Has Built Wealth

Yearly return data for the S&P 500® Index, 1926–2024

Two Charts Showing Yearly return data for the S&P 500® Index, 1926–2024
Source: Standard & Poor’s and Lord Abbett. Returns are measured based on the S&P 500® Index from January 1, 1926, to June 30,2025. Past performance is not a reliable indicator or guarantee of future results. For illustrative purposes only and does not represent any specific portfolio managed by Lord Abbett or any particular investment. Indexes are unmanaged, do not reflect the deduction of fees and expenses, and are not available for direct investment.

The second phase of long-term wealth creation is wealth preservation during retirement. Over the last three decades, investors have experienced three major market downturns: the 1999-2000 “tech bubble,” the global financial crisis of 2008–09, and the onset of the COVID-19 pandemic in early 2020. In each of these periods, investors fled from equity markets in an attempt to preserve assets. Yet, a hypothetical investment in the S&P 500 versus a fixed-income alternative, the Bloomberg US Aggregate Bond Index (with 5% withdrawals adjusted for inflation), shows two entirely different retirement outcomes (Figure 4). One investor is making ends meet, while the other has a lot of flexibility in their retirement lifestyle and estate planning. 

Figure 4. How Two Different Retirement Portfolios Have Fared Over the Past 30 Years

Hypothetical growth of a $1,000,000 investment in the S&P 500® and Bloomberg U.S. Aggregate Bond Indexes from December 31, 1994, assuming annual 5% withdrawals, to June 30, 2025

Line Chart Showing Hypothetical growth of a $1,000,000 investment in the S&P 500® and Bloomberg U.S. Aggregate Bond Indexes from December 31, 1994, assuming annual 5% withdrawals, to June 30, 2025
Source: Standard & Poor’s and Lord Abbett. Past performance is not a reliable indicator or guarantee of future results. Data does not represent current market data but is included as an illustration of the historical returns of the indicated indexes for the period under review. The analysis contained herein does not constitute a personal recommendation or investment advice and should not be used as the basis for any investment decision. For illustrative purposes only and does not represent any specific portfolio managed by Lord Abbett or any particular investment. Indexes are unmanaged, do not reflect the deduction of fees and expenses, and are not available for direct investment.

Regardless of whether an investor is in the accumulation phase or the preservation phase, it’s worth repeating that it is important for investors to focus on “time in” the market as opposed to “timing” the market.

Weathering Tough Times with Dividend Growers

We believe a thoughtful and diversified approach is vital to weathering periods of market drawdowns. It is important to remain invested in the equity markets, as the potential for long-term growth can lead to a larger nest egg in retirement. Yet, it is sometimes inevitable for emotional decision-making to take over during uncertain time periods. We think one way of alleviating this stress is by selecting a portfolio that has demonstrated lower historical volatility. If we look at the last 50 years of data, high-quality companies that are initiating and growing dividends have had higher returns and lower volatility than the equal-weighted S&P 500® Index as shown in Figure 5.

Figure 5. Dividend Growers Have Offered Higher Returns with Less Volatility

Data for the S&P 500 Index, January 31, 1973–December 31, 2024

Scatter Plot Chart Showing Data for the S&P 500 Index, January 31, 1973–December 31, 2024
Source: Ned Davis Research. Latest available full-year historical data.
Dividend policy: A stock is classified as a dividend payer if it paid a cash dividend any time during the previous 12 months; a dividend grower if it initiated or raised its cash dividend at any time during the previous 12 months; and a non-dividend payer if it did not pay a cash dividend at any time during the previous 12 months. A company's dividend payments may vary over time, and there is no guarantee that a company will pay a dividend at all.
Standard deviation is a statistic that measures the dispersion of a data set relative to its mean. The higher the standard deviation, the further the observed data are from the mean.
Past performance is not a reliable indicator or guarantee of future results. For illustrative purposes only and does not represent any specific portfolio managed by Lord Abbett or any particular investment. Indexes are unmanaged, do not reflect the deduction of fees and expenses, and are not available for direct investment.

While this chart shows a slight deviation between dividend growers and dividend payers, in recent years, we’ve seen a higher dispersion. Since 2020, the markets have endured a COVID-19 shutdown, the inflation-driven correction of 2022, a narrow market rebound led by mega cap tech names, and tariff uncertainty due to a volatile trade war. In Figure 6, we examine how three indexes performed across these events, one of which is dividend-growth focused, and the other two centered on high dividend yield. The S&P U.S. Dividend Growers Index significantly outperformed the two yield-focused indexes while displaying much lower volatility. While dividend payers across the board provided strong downside capture, we can see that dividend growers didn’t sacrifice on the upside to accomplish this, which resulted in stronger absolute and risk-adjusted performance. 

Figure 6. Dividend Growers versus High Dividend Yield

Return and Risk Data for S&P U.S. Dividend Growers, Dow Jones U.S. Select Dividend, and S&P High Yield Dividend Aristocrats

Chart Showing Return and Risk Data for S&P U.S. Dividend Growers, Dow Jones U.S. Select Dividend, and S&P High Yield Dividend Aristocrats
Source: Morningstar, Standard & Poor’s, Dow Jones Indices. Latest available historical data. Capture ratios are relative to the S&P 500® Index. The S&P U.S. Dividend Growers index tracks U.S. companies that have increased their dividend per share for at least 10 consecutive years while excluding the top 25% highest-yielding eligible companies. The Dow Jones U.S. Select Dividend Index consists of the top 200 companies based on dividend yield in the Dow Jones U.S. Index. The S&P High Yield Dividend Aristocrats is a dividend-yield-weighted index of stocks in the S&P Composite 1500 that have increased their dividend per share for the last 20 consecutive years.
Past performance is not a reliable indicator or guarantee of future results. For illustrative purposes only and does not represent any specific portfolio managed by Lord Abbett or any particular investment. Indexes are unmanaged, do not reflect the deduction of fees and expenses, and are not available for direct investment.

Lower volatility may mean investors will be less likely to reduce equity exposure following a market drawdown. In a sense, if the drawdown is less severe or perhaps just lower than the overall S&P 500, an investor may be less likely to reduce equity exposure at an untimely moment. The outcome of owning a lower-volatility portfolio of dividend growth companies may mean not only superior risk-adjusted returns but also a better “lived outcome;” one that is devoid of the risk of market timing that can limit long-term returns. Such an approach may leave investors in a better position to grow their wealth over the long term—and provide themselves with a more assured financial future.