Key Points

  • Comparing similar-quality asset-backed securities (ABS) and commercial mortgage-backed securities (CMBS) to agency mortgage-backed securities (MBS) shows an opportunity for better excess and risk-adjusted returns.
  • Investment-grade credit sectors historically have offered very low default risk and attractive spread compensation.
  • In-depth fundamental credit research within an actively managed approach to core bonds can help to harvest the outperformance potential over the long term to the core bond benchmark.

Examining the Aggregate Bond Index

In November 2023, my colleague, Joseph Graham, wrote a piece regarding active management in core bonds. We would like to explore this further in the context of a multi-sector approach. Figure 1 shows the updated composition of the Bloomberg Aggregate Bond Index (Agg); and it is still the case today that non-Treasury risk remains focused on two sectors: U.S. agency MBS and investment-grade corporate bonds, with each comprising approximately 25% of the benchmark.

Figure 1. U.S. Treasury and Agency Debt Continue to Dominate the Agg

Composition of the Bloomberg U.S. Aggregate Bond Index by percent of market value weight, July 31, 2024

Figure 1
Source: Bloomberg. Data as of July 31, 2024. Government-related securities are publicly issued debt of U.S. government agencies, quasi-federal corporations, and corporate or foreign debt guaranteed by the U.S. government. Treasuries are risk-free debt securities issued by the U.S. government and secured by its full faith and credit. Income from Treasury securities are exempt from state and local taxes. Past performance is not a reliable indicator or guarantee of future results. The historical data shown in the chart above are for illustrative purposes only and do not represent any specific portfolio managed by Lord Abbett.

Successful active management to outperform the Bloomberg Aggregate would, of course, include an element of correctly overweighting and underweighting risk in these sectors relative to the benchmark. But we would also suggest that a consistent overexposure to risk in investment-grade sectors as well as a more significant use of the sectors, which comprise only 2% of the total of the Bloomberg Aggregate Bond Index, i.e., ABS and CMBS, are key to consistent risk-adjusted outperformance.

Through the Lens of Credit Quality: Agency MBS, ABS, and CMBS

U.S. agency MBS was once considered to be backed with the implicit guarantee of the U.S. government prior to the Great Financial Crisis (GFC). But upon being placed into government conservatorship in 2008, the cashflows of agency MBS are understood to have an even stronger “explicit” guarantee; hence, an investor in agency MBS does not assume default risk. Instead, the investor assumes negative convexity—the value of a bond with negative convexity can decline with a decline in interest rates—and prepayment risk, and given the dynamism of interest rates, this risk is costly and erodes spread compensation, income, and return, both total and excess.

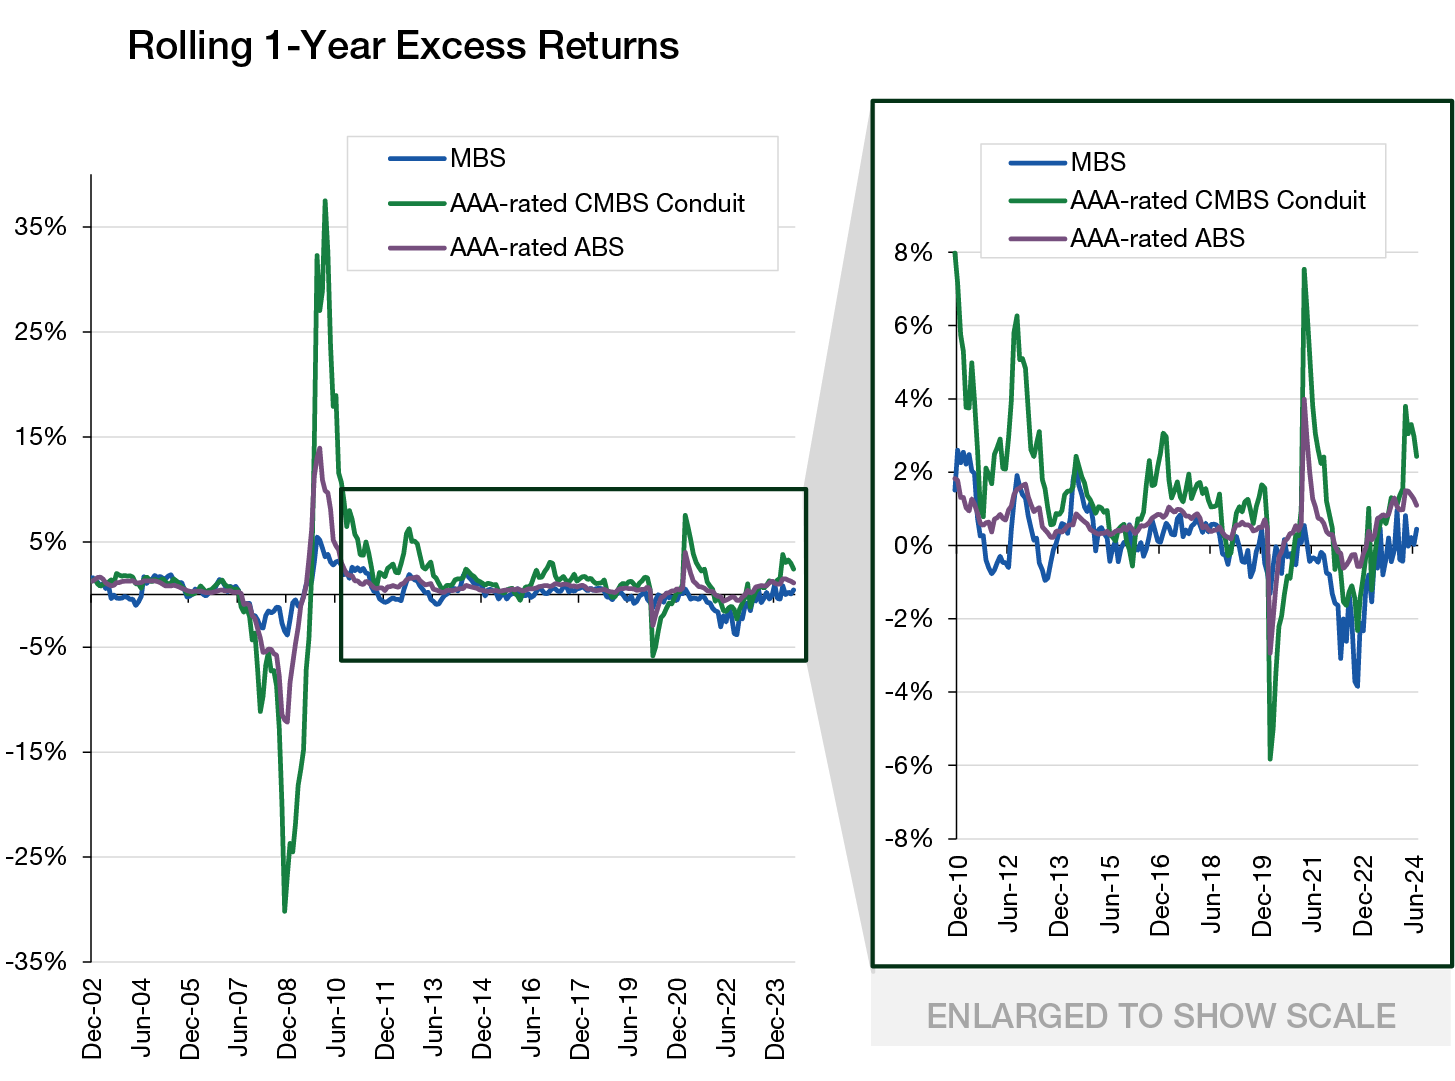
With the downgrades of the United States by S&P and Fitch in 2011 and 2023, respectively, one could argue that AAA-rated securities would be a higher-quality investment compared to agency MBS. In the spirit of this comment, we wanted to explore the historical returns and volatility experience of AAA-rated ABS and CMBS relative to agency MBS. In other words, since agency MBS is a major component of the Bloomberg Aggregate Index, in a hypothetical and extreme sense, is there a “replacement” benefit of allocating to high-quality, AAA-rated ABS and/or CMBS?

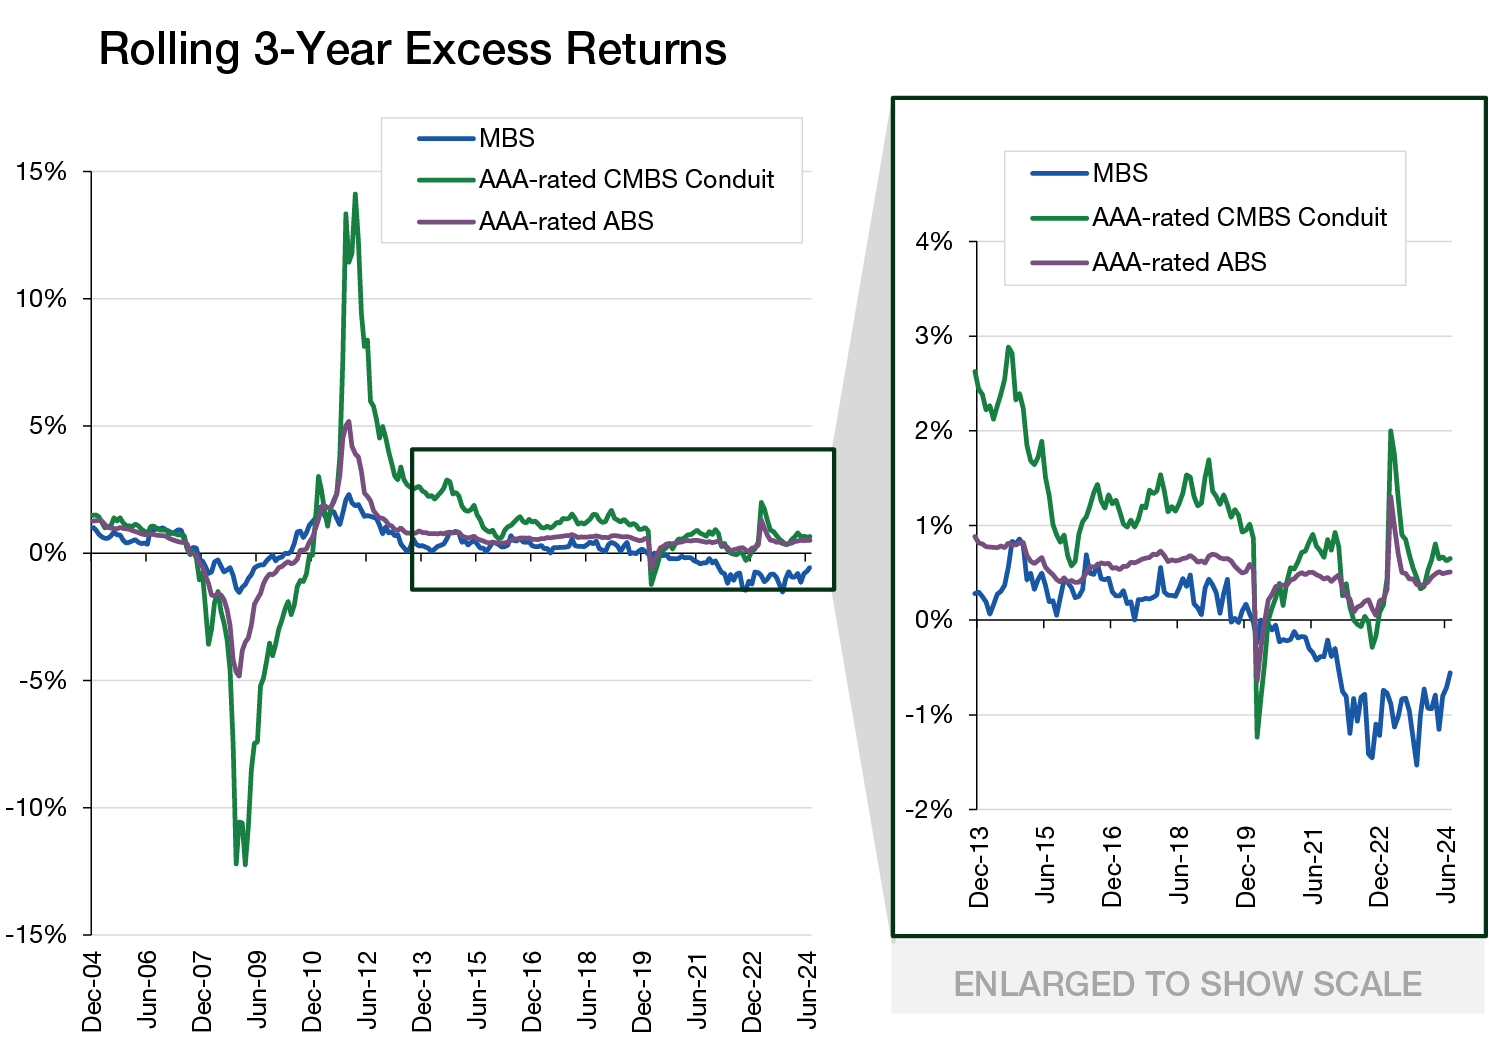
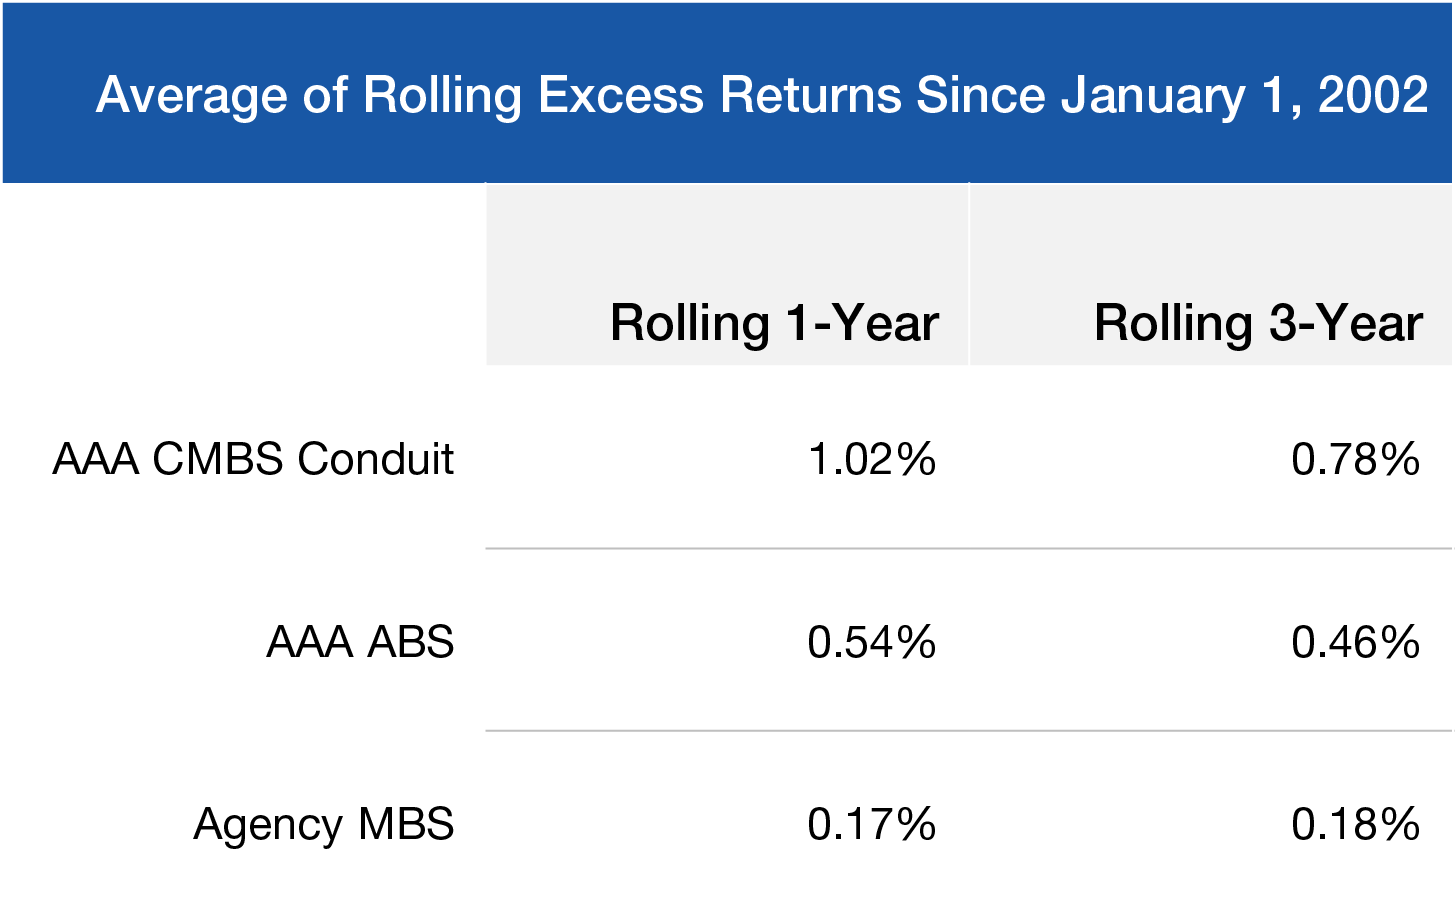
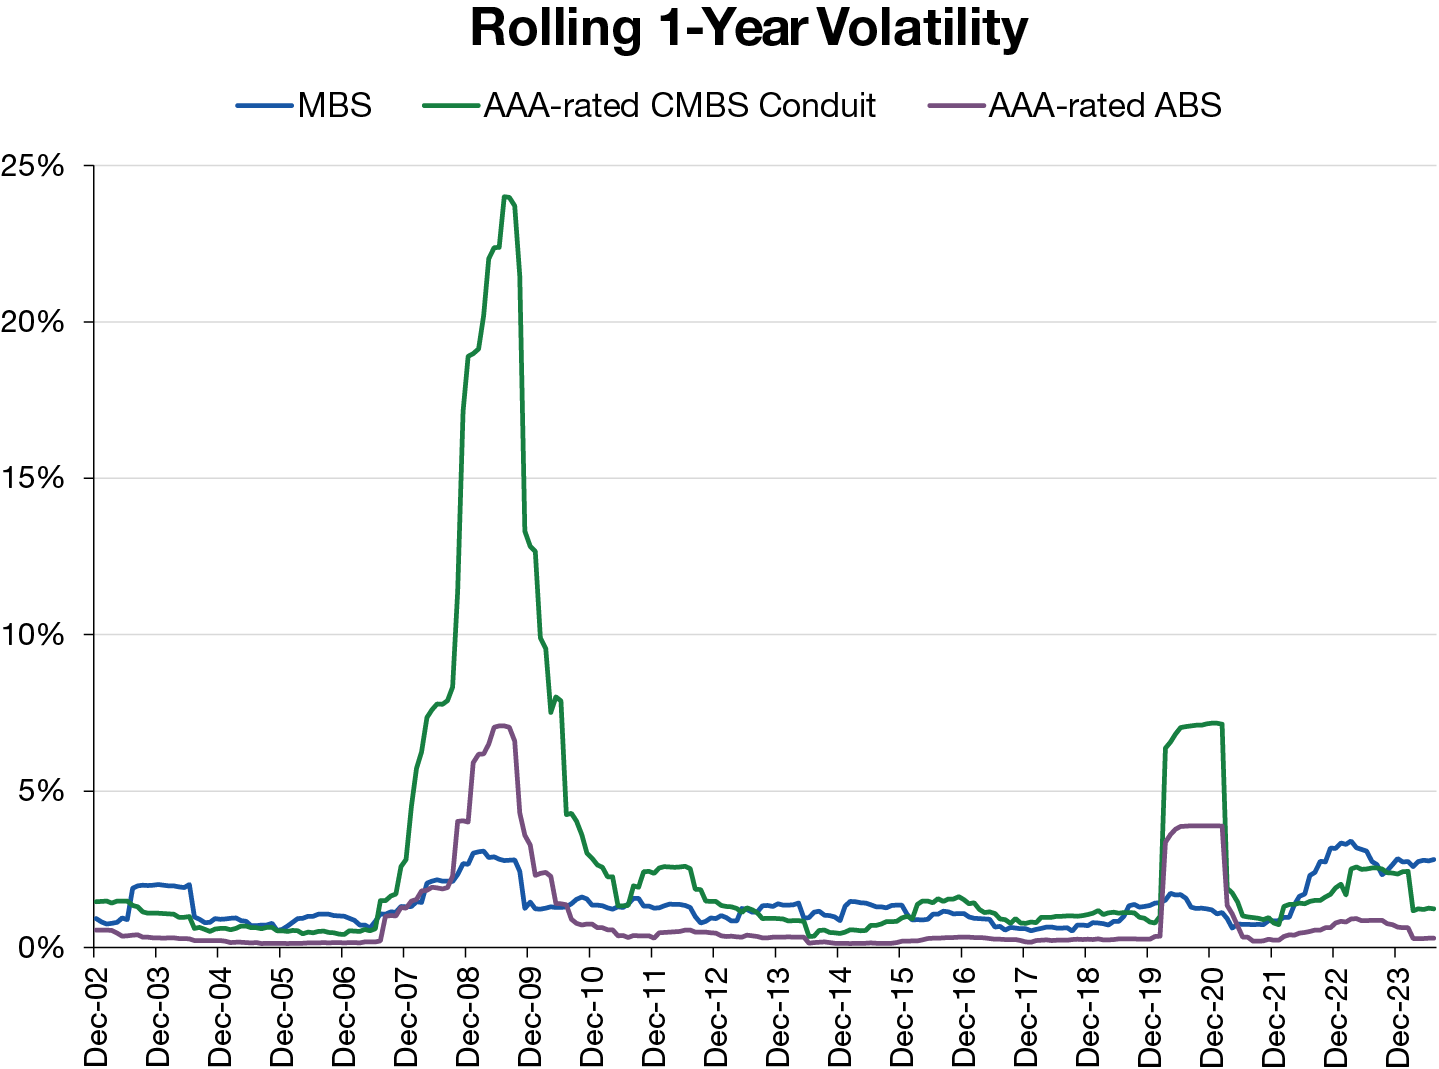
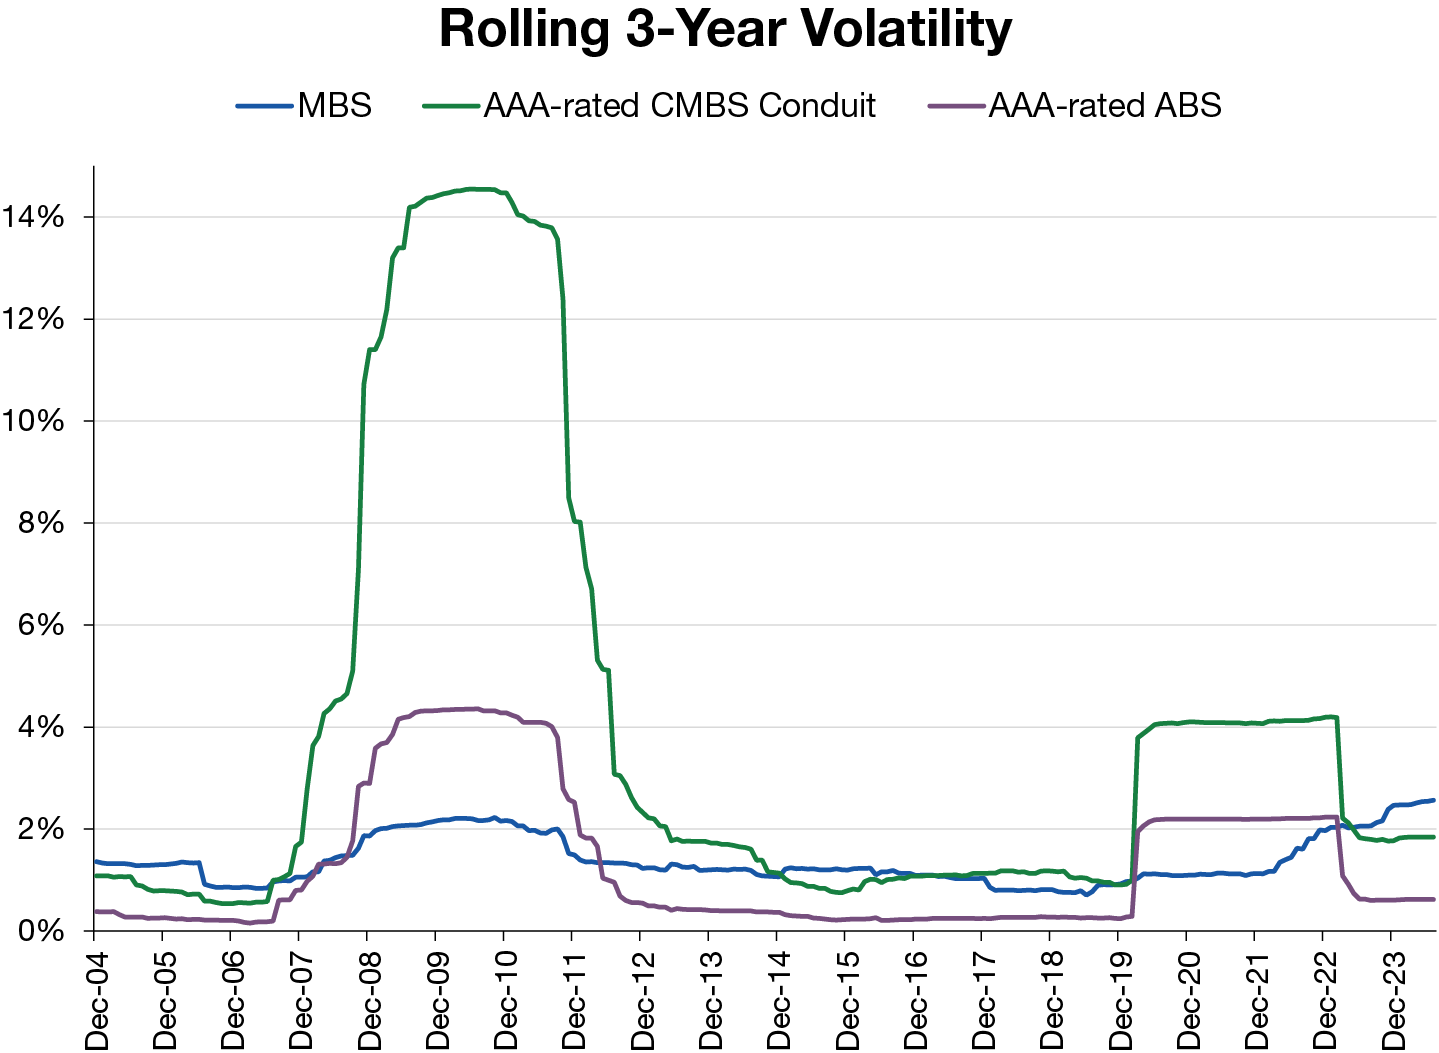
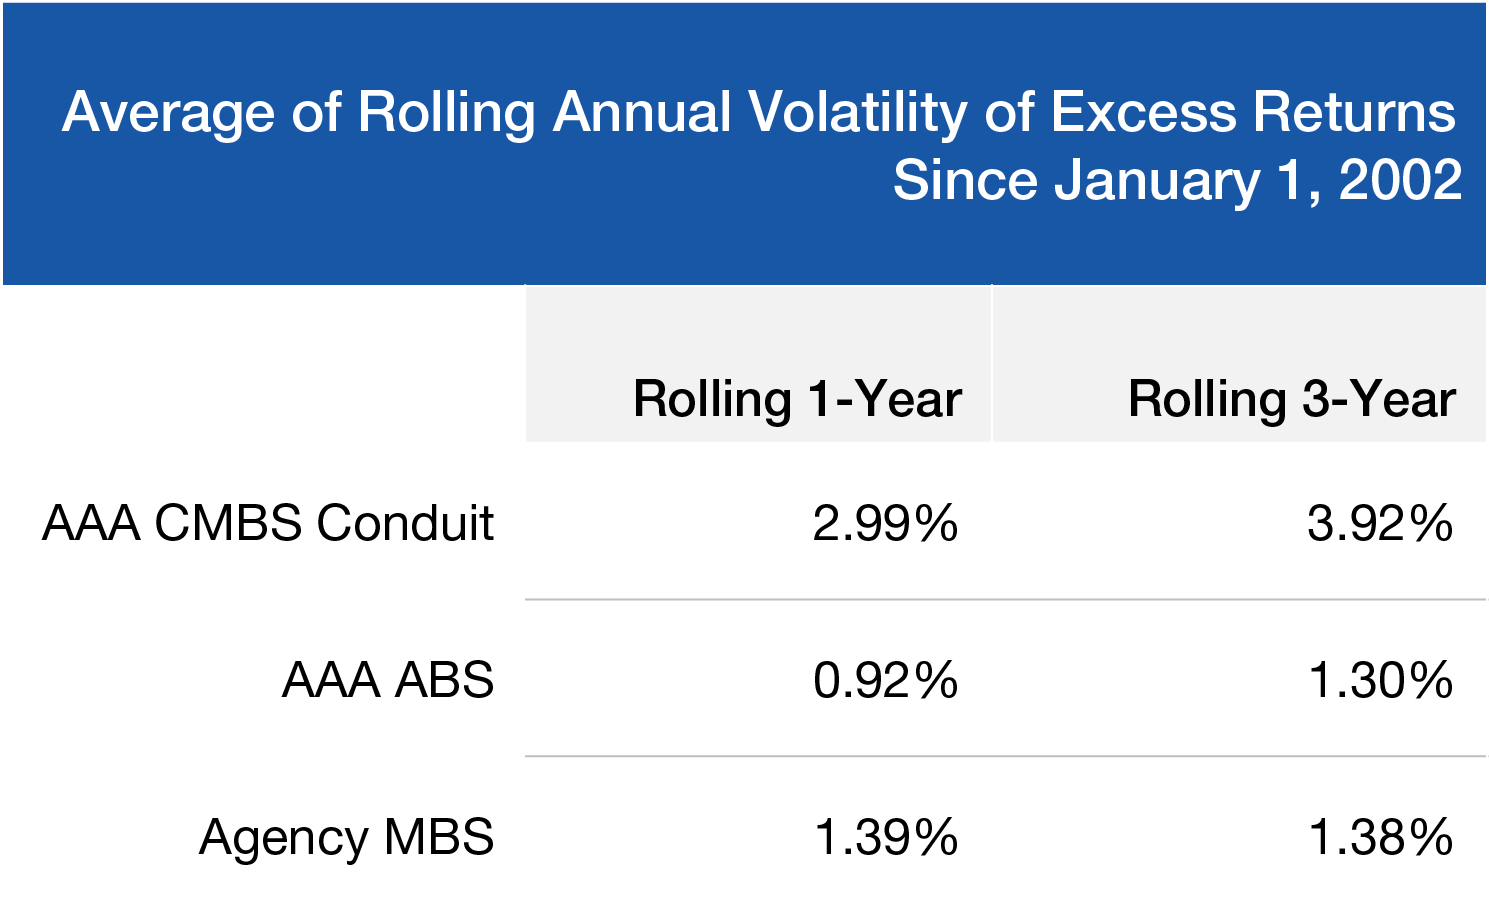
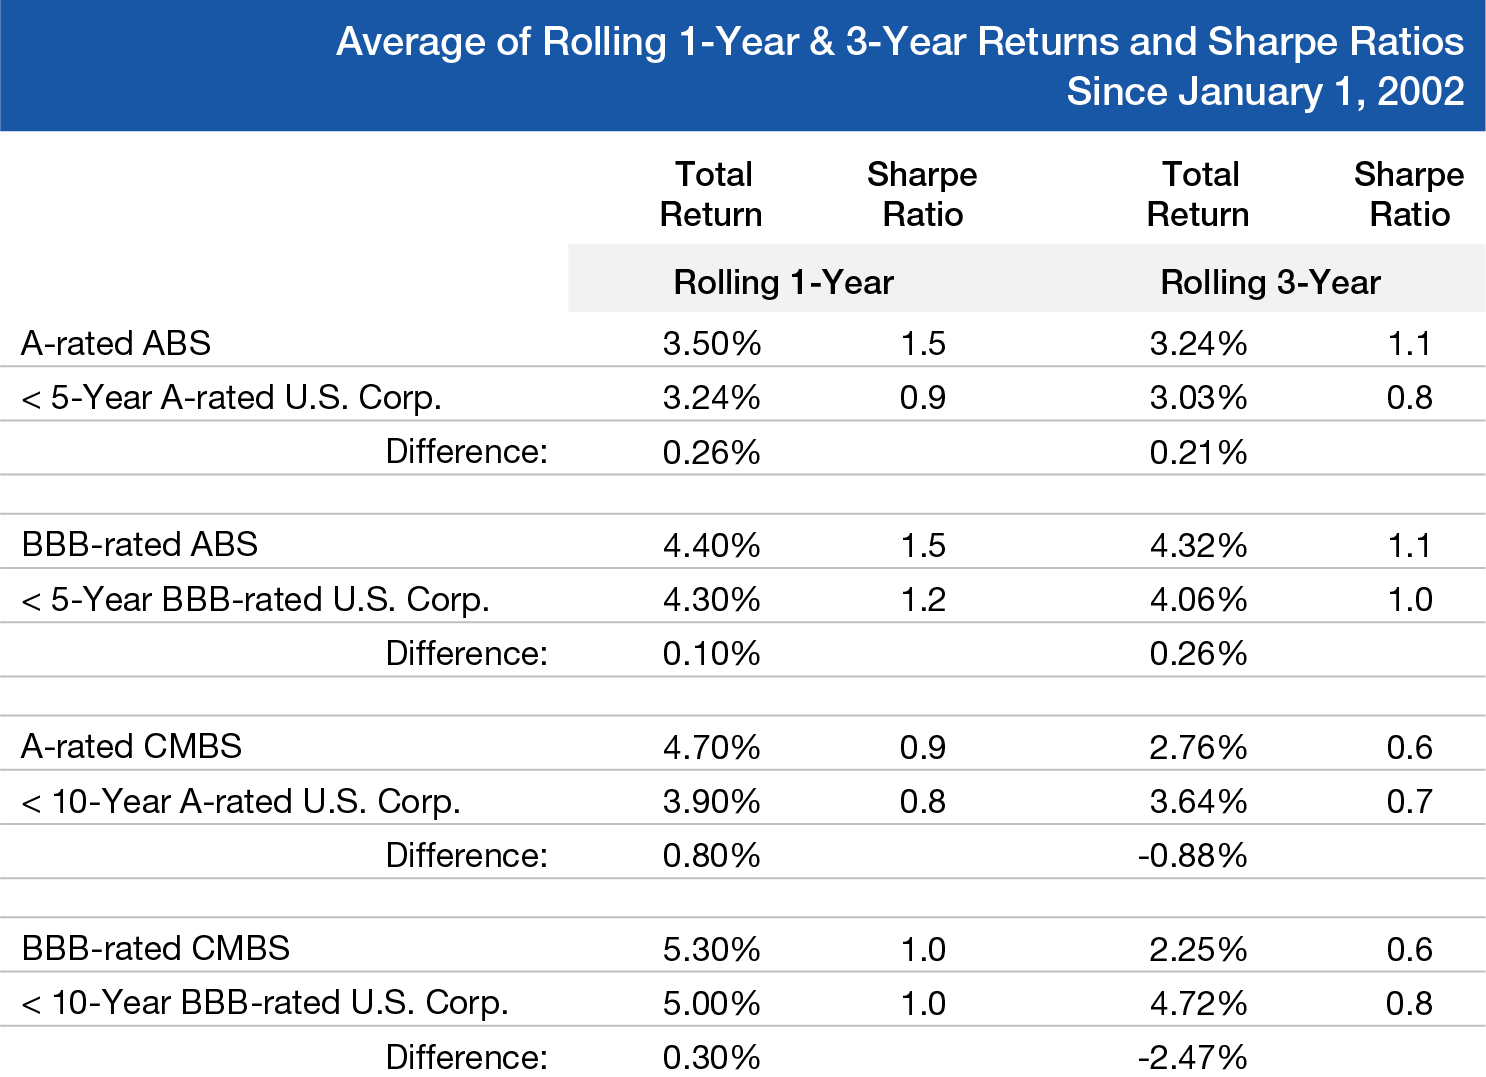
For the analysis, we use a more complete and robust data set provided by ICE BofA indexes, i.e., a longer historical availability as well as a more complete representation of the opportunity set within ABS, CMBS, and MBS. In Figure 2, we represent the rolling one- and three-year excess returns of agency MBS, AAA-rated ABS, and AAA-rated conduit CMBS. And as the table at the end of Figure 2 shows, the averages of the rolling excess return for AAA-rated conduit CMBS and AAA-rated ABS have both historically exceeded the excess returns of agency MBS over the last approximately 20 years.

Figure 2. ABS and CMBS Offer Attractive Excess Return Potential

Rolling one-year and three-year annualized excess returns for the periods November 30, 2002-July 31,2024, and November 30, 2004-July 31, 2024, respectively

Figure 2
Figure 2 Continued
Rolling one-year and three-year annualized excess returns for the periods November 30, 2002-July 31,2024, and November 30, 2004-July 31, 2024, respectively
Source: ICE Data Indices, LLC. Excess returns to U.S. government securities. Data as of July 31, 2024. MBS, AAA-rated CMBS conduit, and AAA-rated ABS components of the ICE BofA U.S. Broad Market Index. Conduit CMBS are sometimes referred to as conduit loans and are loans that are pooled and securitized so as to be sold to investors for a return. Treasuries are risk-free debt securities issued by the U.S. government and secured by its full faith and credit. Income from Treasury securities are exempt from state and local taxes. Past performance is not a reliable indicator or guarantee of future results. The historical data shown in the chart above are for illustrative purposes only and do not represent any specific portfolio managed by Lord Abbett.

In our view, spread compensation is certainly payment for the default risk of an asset; but within spread compensation, consideration should also be given to liquidity as well as volatility. And as we can see in Figure 2, the volatility of CMBS was especially significant during the GFC. So, it is reasonable for the spread compensation to include some payment for an investor to assume this risk of mark-to-market volatility. In Figure 3, we highlight the volatility of excess returns over the same one- and three-year rolling periods and summarize the average volatility.

Figure 3. How ABS and CMBS Volatility Stacks Up

Rolling one-year and three-year annualized volatility for the periods November 30, 2002-July 31,2024, and November 30, 2004-July 31, 2024, respectively 

Figure 3
Figure 3 Continued
Figure 3 Continued
Source: ICE Data Indices, LLC. Volatility as measured by annualized standard deviation of excess returns. Data as of July 31, 2024. MBS, AAA-rated CMBS conduit, and AAA-rated ABS components of the ICE BofA U.S. Broad Market Index. Conduit CMBS are sometimes referred to as conduit loans and are loans that are pooled and securitized so as to be sold to investors for a return. Past performance is not a reliable indicator or guarantee of future results. The historical data shown in the chart above are for illustrative purposes only and do not represent any specific portfolio managed by Lord Abbett.

It is interesting to note the rise of excess return volatility for agency MBS as of late; it is understandable given the significantly higher-volatility environment in which we have found ourselves, with the backdrop of the largest increase in the fed funds rate in the shortest period of time to combat inflation. But the main takeaway here is the AAA-rated ABS has the lowest volatility of excess returns. Again, in the hypothetical scenario of sector “replacement,” one could argue that an asset class that has the highest excess return but also the highest volatility (AAA-rated CMBS) is not an obvious replacement candidate, but in AAA-rated ABS, we find a sector that historically has a higher excess return and lower volatility than agency MBS.

Securitized Structure Has Historically Protected Higher Quality

We’ve suggested that some part of the spread compensation for a AAA securitized product is for the volatility and mark-to-market risk of the asset, but there are other elements to spread that we should highlight. First, related to volatility, there is a liquidity premium within spread compensation, i.e., in changing market conditions, the liquidity of an investment can fluctuate, and the cost of transaction can be volatile. Second, there is, of course, the traditional default risk premium; as an example, and specifically within ABS and consumer finance, a borrower is unable to receive a loan for an auto purchase at a risk-free rate. There needs to be an additional spread to reflect the risk of a borrower default given a credit score, financial health, etc. And this spread found in a borrowing rate is distributed to all classes or tranches of a securitized product, and therein, we find our last contribution to spread compensation, a complexity risk premium.

The nature of a securitized product is that any defaults and losses realized in the underlying loans of the securitized product are allocated to the lowest-rated tranches with priority, i.e., the lower-rated tranches “protect” the flow of principal to the highest-rated tranches. And because of this structure, defaults and losses can have a negative multiplier effect on principal loss to lower-rated tranches when compared to the principal loss, given default and recovery in traditional non-structured corporate debt. It is the understanding and successful analysis of this complexity risk through deep fundamental research and active management that can be a consistent source of alpha in portfolio strategies.

As we can see from Figure 4, the structure of securitized products has been very successful in the protection of the highest-rated securities; and with this in mind, we can focus next on the non-AAA portion of the Bloomberg Aggregate Index: investment-grade corporates.

Figure 4. Historically, Negligible Defaults for Higher-Quality ABS and CMBS

Historical default rates by sector and credit quality

Figure 4
Source: S&P Global Ratings. Default rates based on one-year average default rates over the following periods studied: Corporates based on 1981-2023 data; U.S. ABS based on 1983-2023 data; U.S. CMBS based on 1986-2023. Most recent data available. For illustrative purposes only and does not represent any specific portfolio managed by Lord Abbett or any particular investment. Historical default rates are not a reliable indicator or guarantee that defaults will continue to be low, particularly in volatile and declining markets. Past performance is no guarantee of future results.

Assessing ABS, CMBS, and Corporates of Similar Credit Quality and Duration

From a historical perspective, it can be effectively argued that active management through a multi-sector approach using securitized products can be reliable in generating excess return versus one of the largest non-Treasury components of the Bloomberg Aggregate, i.e., agency MBS, without giving up credit quality or return volatility. Now, we turn our attention to the other significant non-Treasury component of the Bloomberg Aggregate: investment-grade corporate bonds.

For this analysis, we can remove the variable of differing effective durations by comparing ABS indexes to shorter-maturity corporates, while comparing CMBS indexes to corporates with a maturity of up to 10 years. This is appropriate given the usually shorter-maturity nature of loans within consumer finance, e.g., auto loans, while commercial real estate loans and securities have a maturity at 10 years within the conduit CMBS space. In this way, we can observe total returns of the various indexes and derive traditional Sharpe ratio measures for comparison. We also focus solely on A- and BBB-rated indexes, given these ratings make up 92% of the securities within investment-grade corporates.

As an example, Figure 5 shows the historical one-year rolling total returns for the A-rated ABS Index and the A-rated corporate bond index with a maturity of less than five years. Within this historical observation, the average of one-year rolling total returns of ABS shown in the table at the end of Figure 5 was 3.50%, compared to 3.24% for A-rated corporates. And upon calculating the time series for the volatility of these returns, we’re able to derive Sharpe ratios for the complete set of comparisons found in Figure 4.

Figure 5. ABS and CMBS Feature Attractive Risk-Adjusted Returns

Rolling one-year returns for the period November 30, 2002-July 31,2024 

Figure 5
Figure 5 Continued
Source: ICE Data Indices, LLC. Data as of July 31, 2024. A-rated ABS, < 5-Year A-rated U.S. Corp., BBB-rated ABS, < 5-Year BBB-rated U.S. Corp., A-rated CMBS, < 10-Year A-rated U.S. Corp., BBB-rated CMBS, and < 10-Year BBB-rated U.S. Corp. components of the ICE BofA U.S. Broad Market Index. Sharpe ratio was developed by Nobel laureate William F. Sharpe as a measure of risk-adjusted performance. It is calculated by taking an asset class’s (or portfolio’s) excess return above the risk-free rate and dividing it by the standard deviation of its returns. The greater the Sharpe ratio, the better the risk-adjusted performance has been. Past performance is not a reliable indicator or guarantee of future results. The historical data shown in the chart above are for illustrative purposes only and do not represent any specific portfolio managed by Lord Abbett

Figure 5 shows that for like-rated ABS indexes, there is a historically persistent higher total return as well as Sharpe ratio. The same can be said for A-rated CMBS when observing one-year rolling total returns. But the extraordinary circumstances of COVID-19, including operating income of commercial properties within the hotel and retail space becoming a complete unknown, followed by office property devaluation in a new regime of flexible work environment, exposed the fragility of the CMBS structure and the potential leveraged exposure to losses that lower-rated tranches are exposed to as they protect the most senior-rated tranches in a securitization. Hence, over longer time horizons of three years, the CMBS sector in A-rated and BBB-rated bonds lagged like-rated corporates significantly. But, once again, we find a sector in ABS, which offers a compelling argument for multi-sector active management to enhance total and excess return without sacrificing return volatility nor credit quality.

Persistent Overexposure to Risk Assets and Active Management

Except for the three-year rolling excess return observations for A- and BBB-rated CMBS, every other index mentioned in this piece for ABS, CMBS, and investment-grade corporates displayed a persistent positive excess return relative to Treasuries over one- and three-year rolling periods. This suggests that in the investment-grade arena and against a Bloomberg Aggregate Index, it is prudent to consistently be overexposed to investment-grade risk in corporates and ABS, and to take advantage of opportunities found through volatility even for sectors such as CMBS. The risk of default in investment-grade debt across sectors has historically been very low, and we believe the spread compensation for assuming this high-quality credit risk will be realized in a positive fashion over long-term investment horizons.

Summing Up

The Bloomberg U.S. Aggregate has two main components of non-Treasury risk: agency MBS and investment-grade corporate bonds. But, if one focuses on the credit quality of each of these sectors, we have shown that in investment-grade securitized products, there are opportunities for incremental excess return without sacrificing credit quality. Within ABS, there is also a potential to improve risk-adjusted return through lower potential volatility. But, at the end of the day, investment in investment-grade assets does yield a return in excess of Treasuries, and by being consistently overexposed to risk in an actively managed portfolio, and by rotating sectors and selecting issues with a deep fundamental research capability, it is possible to generate consistent long-term outperformance versus the Bloomberg Aggregate Index.