2026 Midyear Investment Outlook: In a Resilient Equity Market, Selectivity Matters

The factors that have supported the stock market remain largely intact, but some emerging challenges may require a more differentiated approach to security selection.

Our 2026 year-ahead outlook was entitled “Riding the Tailwinds,” and the equity market was one of the prime beneficiaries of the favorable conditions we saw back in December. U.S. economic growth was healthy, with real gross domestic product (GDP) at around 2% with an upward bias. Inflation, as measured by the U.S. consumer price index, was moderating, having settled into an area below 3%, well off the post-pandemic highs reached in 2022. The labor market was in good condition, with the unemployment rate remaining near multi-decade lows. That favorable backdrop had translated into solid corporate earnings growth, with strong prospects for additional upside in the coming year.

So where do things stand at midyear? Many of those favorable conditions are still intact, in our view, but there are some new challenges that have emerged. And that underscores the theme of our 2026 Midyear Investment Outlook, “Dispersion Favors the Active Opportunity.” The crosscurrents we identify here signal that this will not be a “go-anywhere market.” Investment managers must be able to recognize the changes in the environment and use their expertise to identify the most compelling opportunities for alpha in the months to come, while avoiding areas exposed to negative industry or macro developments.

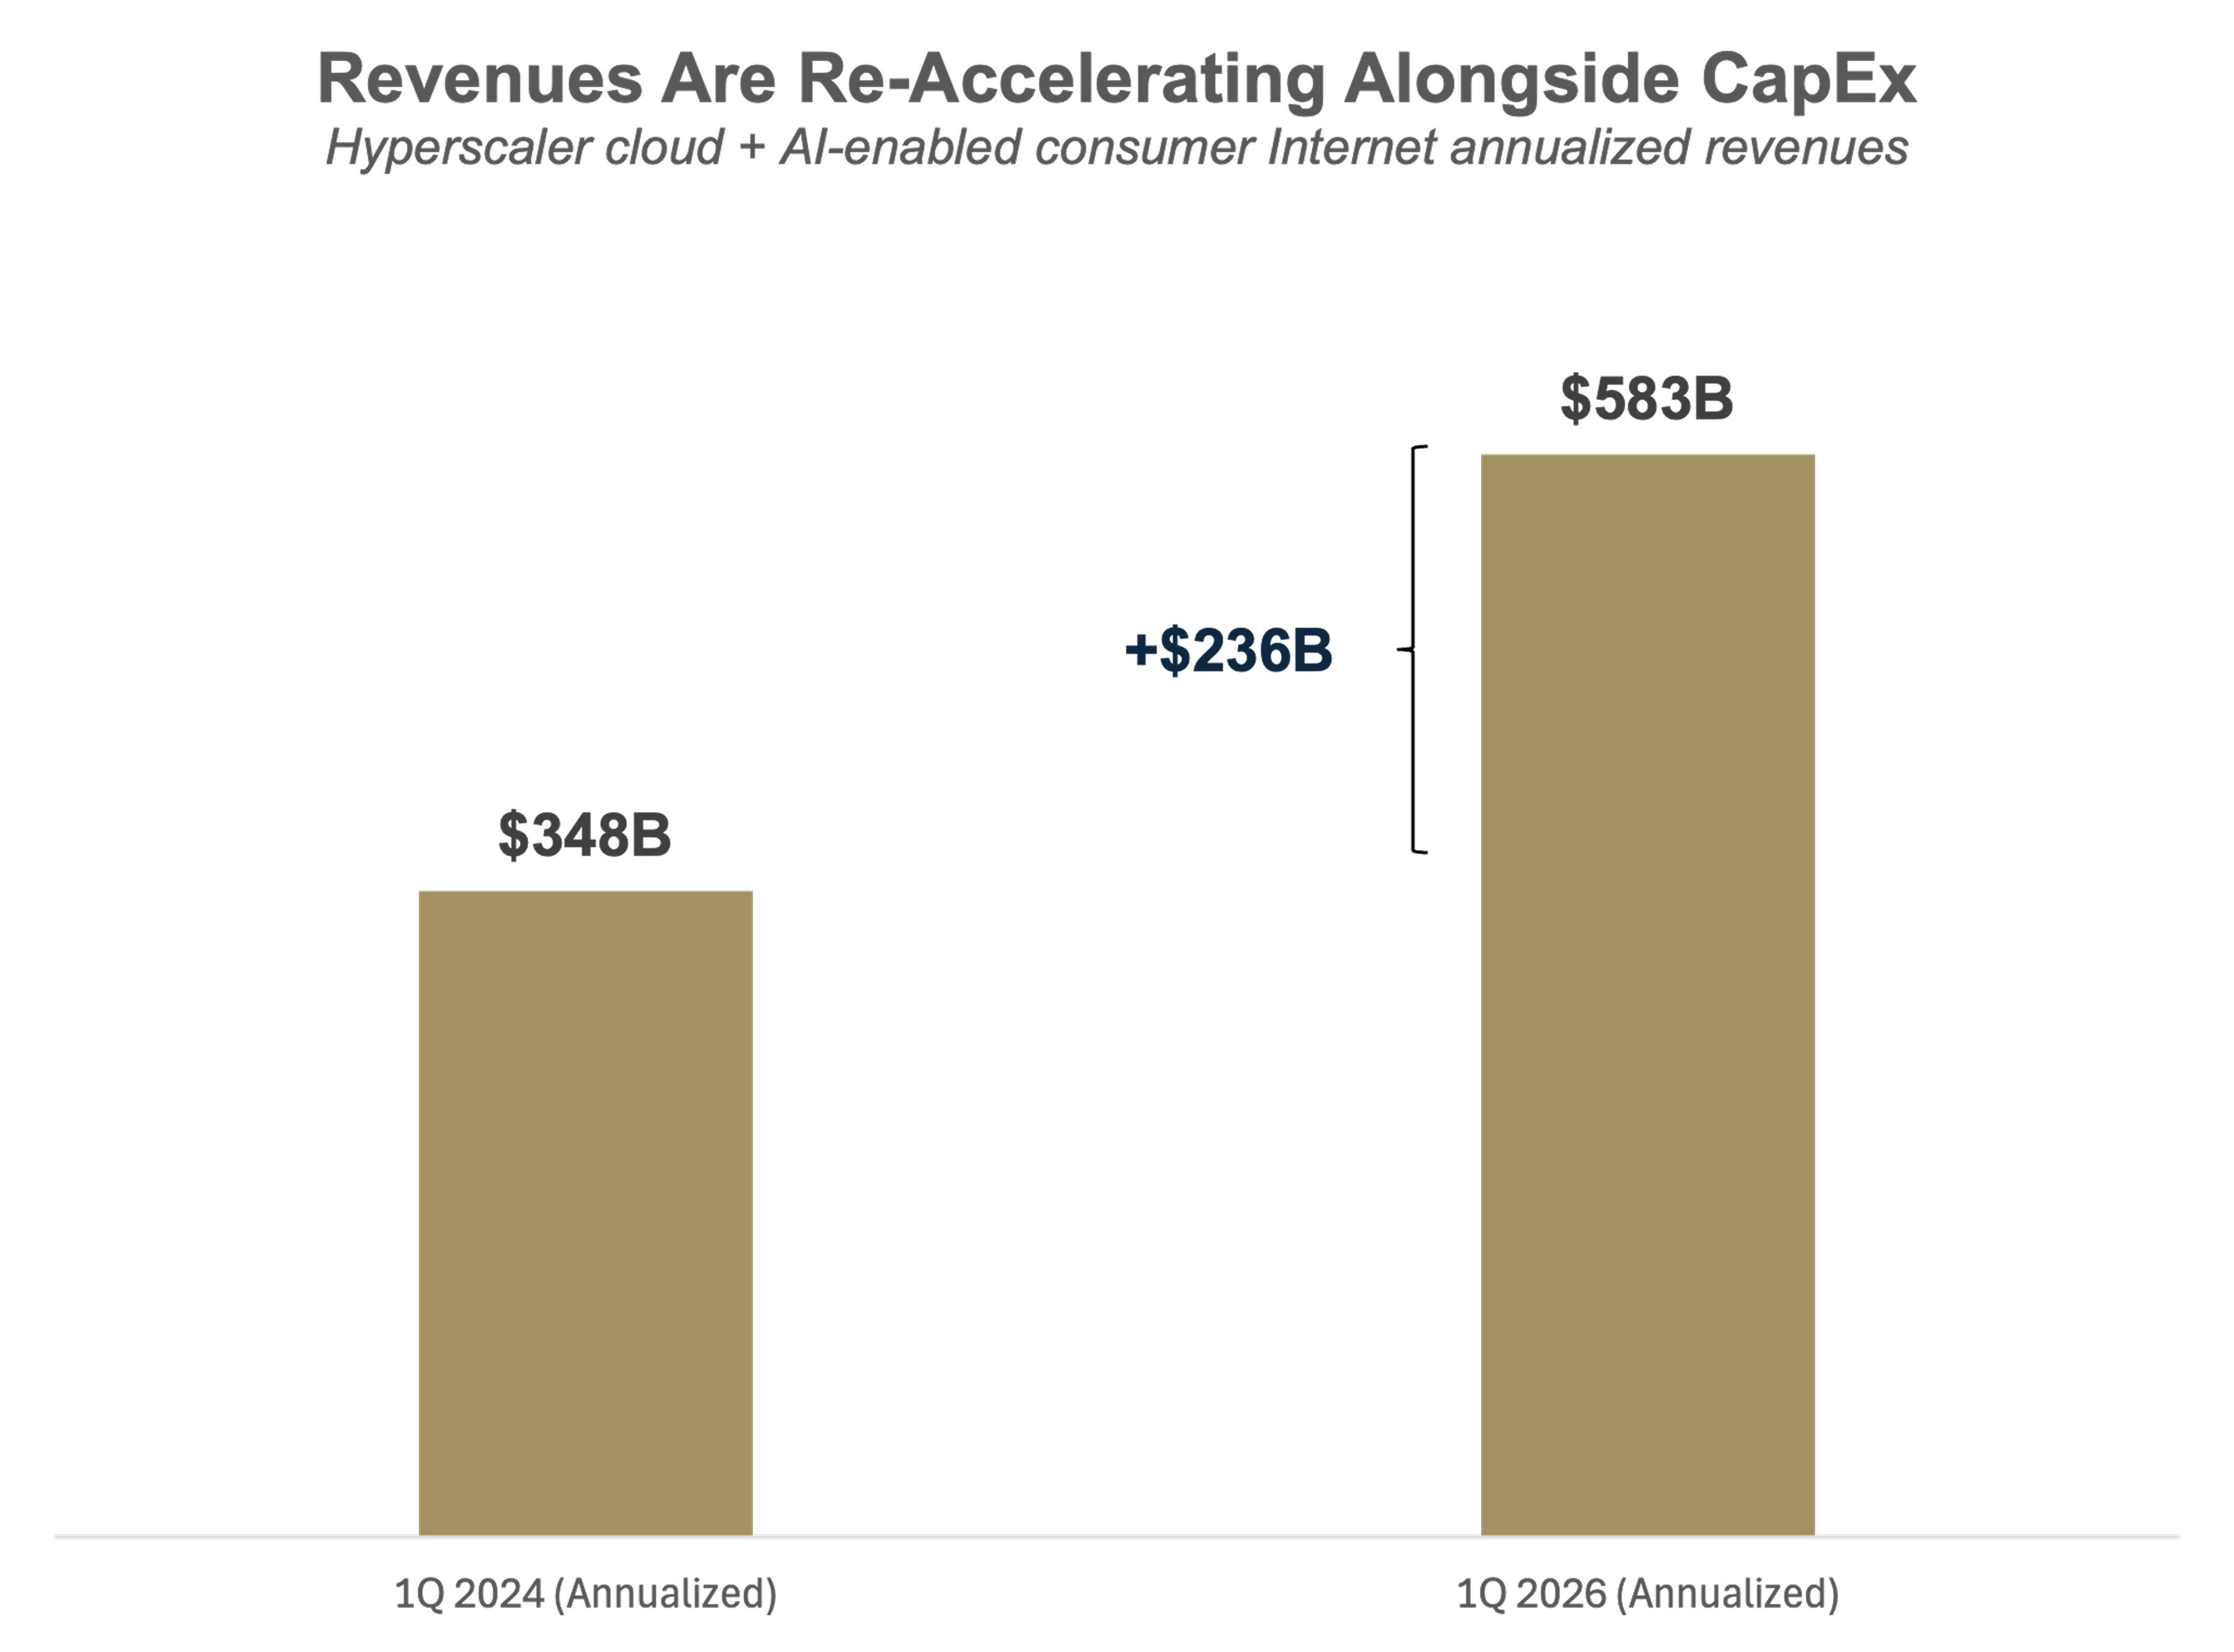
Through the end of May, the S&P 500® Index had gained over 11%, supported by resilient economic growth, improving corporate profits, the continued growth of artificial intelligence (AI) across the economy, and the resultant spending on the build-out of AI infrastructure. (Past performance is not indicative of future results.) But AI is not the only factor influencing the market. Conflict in the Middle East has contributed to a large increase in energy prices, which could lead to an uptick in inflation and weigh on U.S. economic growth.

Let’s take a closer look at the themes poised to influence the market in the second half of the year.

Earnings Remain a Dominant Factor as Strength Poised to Continue

Overall, the earnings picture remains strong. With 97% of S&P 500 companies reporting through the end of May, 85% exceeded analyst earnings forecasts, and 81% exceeded revenue forecasts, both well above long-term averages. S&P 500 earnings growth is now tracking at 28%, year over year for the first quarter, far above the 13% expected earlier in the year (all earnings data presented herein are from FactSet).

Just as important, earnings leadership has broadened beyond the so-called Magnificent Seven tech companies. While these mega capitalization (cap) leaders continue to perform well, earnings growth across the other 493 companies in the S&P 500 has improved meaningfully (see Figure 1). Small cap earnings, which were negative in 2024, turned to strong growth going into 2026. With nearly 95% of the companies in the Russell 2000® Index having reported through the end of May, earnings growth is expected to come in at over 15%, well ahead of expectations at the beginning of the year. Earnings growth has also accelerated outside the United States. This shift signals healthier market breadth and creates opportunities beyond the mega cap market leaders.

Figure 1. Earnings Growth Is Broadening Beyond the Magnificent Seven

Actual and estimated year-over-year earnings growth 

Grouped bar chart comparing earnings growth rates for the Magnificent 7, S&P 500 (excluding top 7), Russell 2000, and MSCI ACWI ex-USA across 2024, 2025, and 2026E, with the Magnificent 7 leading each year.
Data as of 5/31/2026. Source: FactSet and Furey Research. E = estimated. YoY = year-over-year. S&P 500 = S&P 500® Index. Russell 2000 = Russell 2000® Index. MSCI ACWI ex-USA = MSCI All Countries World Index (excluding the United States). The Magnificent 7 (Mag 7) refers to a group of seven mega cap technology and tech-related companies that have dominated U.S. equity market performance in recent years. The companies include: Apple, Amazon, Microsoft, Alphabet, Meta, NVIDIA, and Tesla.
Past performance is no guarantee of future results. Current performance may be higher or lower than the performance data quoted. For illustrative purposes only and does not represent any specific portfolio managed by Lord Abbett or any particular investment. Indexes are unmanaged, do not reflect the deduction of fees or expenses, and are not available for direct investment.

In our view, the earnings backdrop remains a powerful support for equities. Of course, there are risks to that scenario, including the situation in the Middle East and its potential impact on energy prices. But as long as earnings hold up, equities should have a solid foundation for further gains in 2026.

Putting Market Valuations in Context

With every leg higher in the S&P 500, the questions about whether the market is overvalued seem to become more persistent. That concern is understandable: Valuations are above long-term averages by many traditional measures. But valuation alone is rarely a sufficient reason to buy or sell equities. As we have pointed out in the past, valuation needs to be assessed in the context of the market’s underlying fundamentals, which have improved meaningfully over time.

The composition of the S&P 500 is far different than in earlier years. In 1990, manufacturing companies represented 40% of the index; today, that number is 15%. Over the same period, asset-light companies—those less dependent on physical assets such as factories to generate revenue—grew from 25% of the index to 55%. (Preceding figures based on data from FactSet and BofA Global Research.) This shift matters because asset-light businesses generally have more predictable earnings growth, higher margins, and stronger cash conversion, which can allow them to command higher valuation multiples.

That shift has contributed to a meaningful improvement in market fundamentals. Companies have become far more efficient at converting revenue into cash flow, with free-cash-flow margin for the S&P 500 increasing from an average of 4.3% in the 1990s to more than 11.8% so far in the 2020s. Capital discipline has improved as well. Companies are not only generating more cash but also returning more of it to shareholders through dividends and buybacks. Based on data from Empirical Research, in 1990, 25% of the S&P 500’s return on equity came in the form of shareholder payouts; in 2025, that figure rose to 78%.

From that perspective, our view is that today’s higher multiples are not a sign of overly optimistic views on future profitability, but rather a reflection of a market with stronger fundamentals than long-term averages may imply.

The Historic Scale of Today’s AI Capital Spending Rivals the Railroads

As we noted earlier, the biggest story in the equity market in the first half of 2026 has been the enormous amount of capital expenditures (CapEx) on the build-out of AI capabilities across industries, which has helped bolster U.S. economic growth. The hyperscalers—Google, Amazon, Meta, Oracle, and Microsoft—are expected to spend roughly $765 billion on AI-related infrastructure in 2026, a figure equivalent to nearly 2% of U.S. GDP. That places the current AI build-out in the same historical conversation as the railroad expansion of the 1850s.

What makes the AI CapEx boom especially notable is that expectations for spending growth continue to be revised higher. Hyperscaler spending in 2026 is now expected to increase roughly 75% from 2025 levels and is about 30% higher than estimates at the start of the year. Those upward revisions are already lifting sales and earnings expectations for companies positioned to benefit from the build-out, including semiconductor manufacturers, networking equipment providers, HVAC (heating, ventilation, and air conditioning) equipment firms, power suppliers, and other businesses providing the products and services required for AI’s expansion.

However, the question that many have asked is whether the hyperscalers are actually seeing a return on these investments. As Figure 2 shows, this spending is already translating into revenue acceleration. The hyperscalers are expected to invest a combined $1.4 trillion from 2024 through 2026. At the same time, annualized revenues tied to cloud, AI-enabled consumer internet, and related infrastructure have risen from $348 billion in the first quarter of 2024 to $583 billion in the first quarter of 2026—a $236 billion increase—while blended revenue growth has accelerated from roughly 26% to roughly 39%.

Figure 2. AI Infrastructure Spending Is Already Supporting Revenue Growth

Horizontal bar chart showing 2024–2026 cumulative capital expenditures with Amazon at $415B, Microsoft at $384B, Alphabet at $329B, Meta at $242B, and Oracle at $67B.
Bar chart titled “Revenues Are Re-Accelerating Alongside CapEx” showing annualized revenue growth from $348B in 1Q 2024 to $583B in 1Q 2026, an increase of $236B.
Source: FactSet. Company reports and analyst estimates as of 05/31/2026. Revenue data annualized based on Q1 levels for respective years. CapEx = capital expenditures, Hyperscalers are large technology companies that operate massive, globally distributed data centers designed to deliver cloud computing, storage, and networking services at extreme scale. CapEx reflects cumulative 2024–2026 company-reported capital expenditures and estimates; figures are not pure AI-only disclosures and include infrastructure supporting existing cloud, consumer internet, advertising, data center, storage, networking, and AI-related workloads. Revenue pickup compares selected cloud revenue metrics for AWS, Azure/cloud, Google Cloud, and OCI, plus Meta total revenue, from 1Q24 to 1Q26. For illustrative purposes only.

The large increase in AI CapEx represents a project of historical scope that may prove to be a potential boon for the entire economy. The hyperscalers are massive businesses that are seeing growth accelerating to a very large scale, supported by surging demand for AI tools and services. OpenAI and Anthropic, for example, now have a combined revenue run rate of more than $50 billion, reinforcing that AI demand is real today, not merely a future promise. These companies have also said in their earnings calls that if they had more AI factories and more data centers—basically, more computing power—their growth would be faster. The increase in the number of people and businesses around the globe using AI tools is driving a demand for computing power that is outstripping supply.

Of course, every technological revolution produces winners and losers. While AI has been a significant tailwind for the markets, there are companies that will have their business models irrevocably disrupted by the widespread adoption of the technology. Equity investors have been quick to punish those companies that are viewed to be AI “disruptees,” including software firms. In our view, there are many cases where these judgments are premature, and we are continuing to carefully assess the impact of AI on key industries.

Looking Beyond AI

While AI CapEx remains an important theme, it is not the only source of equity opportunity. In a more dispersed market, active managers can find compelling growth in areas where fundamentals, policy priorities, and consumer behavior are shifting in favor of companies with potentially sustainable competitive positioning. We spotlight three areas here:

Aerospace, defense, and the space economy: Commercial aerospace companies have continued to benefit from the worldwide increase in production of jet aircraft. For example, as Boeing increases production, the broader supply chain of companies involved in supplying parts and assembly services may see meaningful growth opportunities.

Defense spending is also increasing in a number of major countries amid rising geopolitical instability. Importantly, that spending is not simply increasing in size; it is also shifting in composition. Governments are directing more capital toward advanced technologies such as drones, hypersonics, cybersecurity, and space-based capabilities. The space economy is an increasingly important part of this opportunity set, as satellites are becoming critical infrastructure for communications, defense, navigation, data collection, and global connectivity. As Figure 3 shows, small satellite launches have increased sharply in recent years, reflecting the growing demand for space-based infrastructure and services.

Figure 3. Small Satellite Launches Reflect Rising Demand for Space-Based Infrastructure

Number of small satellite launches, 2017–2025

Bar chart showing the number of small satellite launches rising from 401 in 2017 to 4,546 in 2025, including a 63% year-over-year increase from 2024 to 2025.
Source: Jefferies, as of 12/31/2025. For illustrative purposes only.

Experiences and live entertainment: We also see opportunities in parts of the consumer economy that may become more valuable as AI-generated content becomes increasingly abundant. As digital content proliferates, scarce real-world experiences—live events, travel, premium hospitality, and cultural attractions—may command a greater share of consumer time and spending. Companies with strong brands, limited supply, and pricing power can benefit from this shift, offering a different way to think about the AI era: not as direct infrastructure beneficiaries, but as businesses whose value may be reinforced by the rising importance of authentic, in-person experiences.

Biotech: Small and mid-sized biotechnology companies are emerging from a four-year bear market, and we think there are a number of appealing candidates in the space. Large pharma companies have effectively used small and medium-sized biotech firms as outsourced research and development (R&D) arms. These smaller biotech firms have created some innovative therapies and diagnostic capabilities, but they are increasingly going after bigger markets; these more attractive opportunity sets may help boost their return on R&D spending.

Attractive Opportunities Outside the United States

The broadening earnings story is not limited to the United States. Outside the U.S., we see improving profit trends and attractive company-level opportunities tied to powerful secular themes. The key distinction is important: We are focused less on targeting individual countries or regions and more on identifying companies—wherever they are located—with durable competitive positioning, strong earnings power, and exposure to long-term growth drivers.

We believe that “companies, not countries” approach is especially relevant today. In Taiwan and Korea, select companies have continued to benefit directly from AI infrastructure demand, particularly through semiconductors and memory. Beyond those markets, the opportunity set is broad. We see regional leaders enabling AI and next-generation computing, building scaled online platforms that serve consumers and a broad range of businesses. Some are direct AI beneficiaries; others are well established platforms, consumer brands, financial inclusion enablers, or industrial leaders shaping tomorrow’s economy in their own markets.

The point is not that the United States is losing ground—we have detailed the inherent strength in U.S. fundamentals and earnings—but that other markets are beginning to catch up after a period in which U.S. mega cap technology companies dominated the global earnings story. Given accelerating earnings growth, fiscal stimulus measures, historically attractive valuations, and secular growth drivers that extend well beyond the United States, we believe investors have plenty of reasons to own both U.S. and non-U.S. equities.

This presents a favorable environment for active managers, in our view. Rather than making broad bets on countries or regions, we think it is more important to find the right companies in each geography. In a market defined by dispersion, selectivity matters—and the opportunity set is increasingly global.

Other Developments to Watch

For the balance of 2026, we will also be looking at technical indicators, especially if the market advance begins to get a bit narrower. Even though earnings breadth has improved, the recent run-up in the markets has been concentrated in a smaller number of stocks.

In terms of sectors, we are keeping an eye on consumer discretionary stocks, which have weakened because of the increase in fuel prices and related concerns over consumer spending. Another oil-related development appears to be the rise in short-term interest rates, which has resulted in a flatter yield curve, which has weighed on financial stocks. Financials may also be vulnerable to concerns about potential weakness in the private credit market.

One final observation: The resilience of the equity market might lead one to ask, given the impact of recent headlines, “where would stock prices be without the overhanging concerns of geopolitics and energy market developments?” Any positive news concerning the war in Iran could potentially provide an additional lift to the markets in the months to come.

Summing Up

Given the generally positive conditions in place—a strong U.S. economy, accommodating financial conditions, accelerating earnings growth, and the powerful influence of the expansion of AI and related spending, we are bullish for the remainder of 2026. But “dispersion” will be the watchword for the remainder of the year, as generating alpha in investment portfolios will require more discipline, based on the widely varying impacts that the trends we have outlined here will have on stocks and sectors. Those are conditions for which active managers may be especially well suited.