Fixed income markets have re-entered a period of heightened volatility in early 2025, as shifting macroeconomic conditions, evolving fiscal policies, and renewed geopolitical uncertainty have led to heightened recessionary fears in the U.S and meaningful movement in credit spreads. However, the high yield market recovered quickly and retraced most of the spread widening in a short span, highlighting the resiliency of the asset class. Below are several reasons why we continue to be constructive on high yield credit, and why we believe that the sector is poised to endure further macroeconomic uncertainty.

Credit Quality of the High Yield Market Has Improved

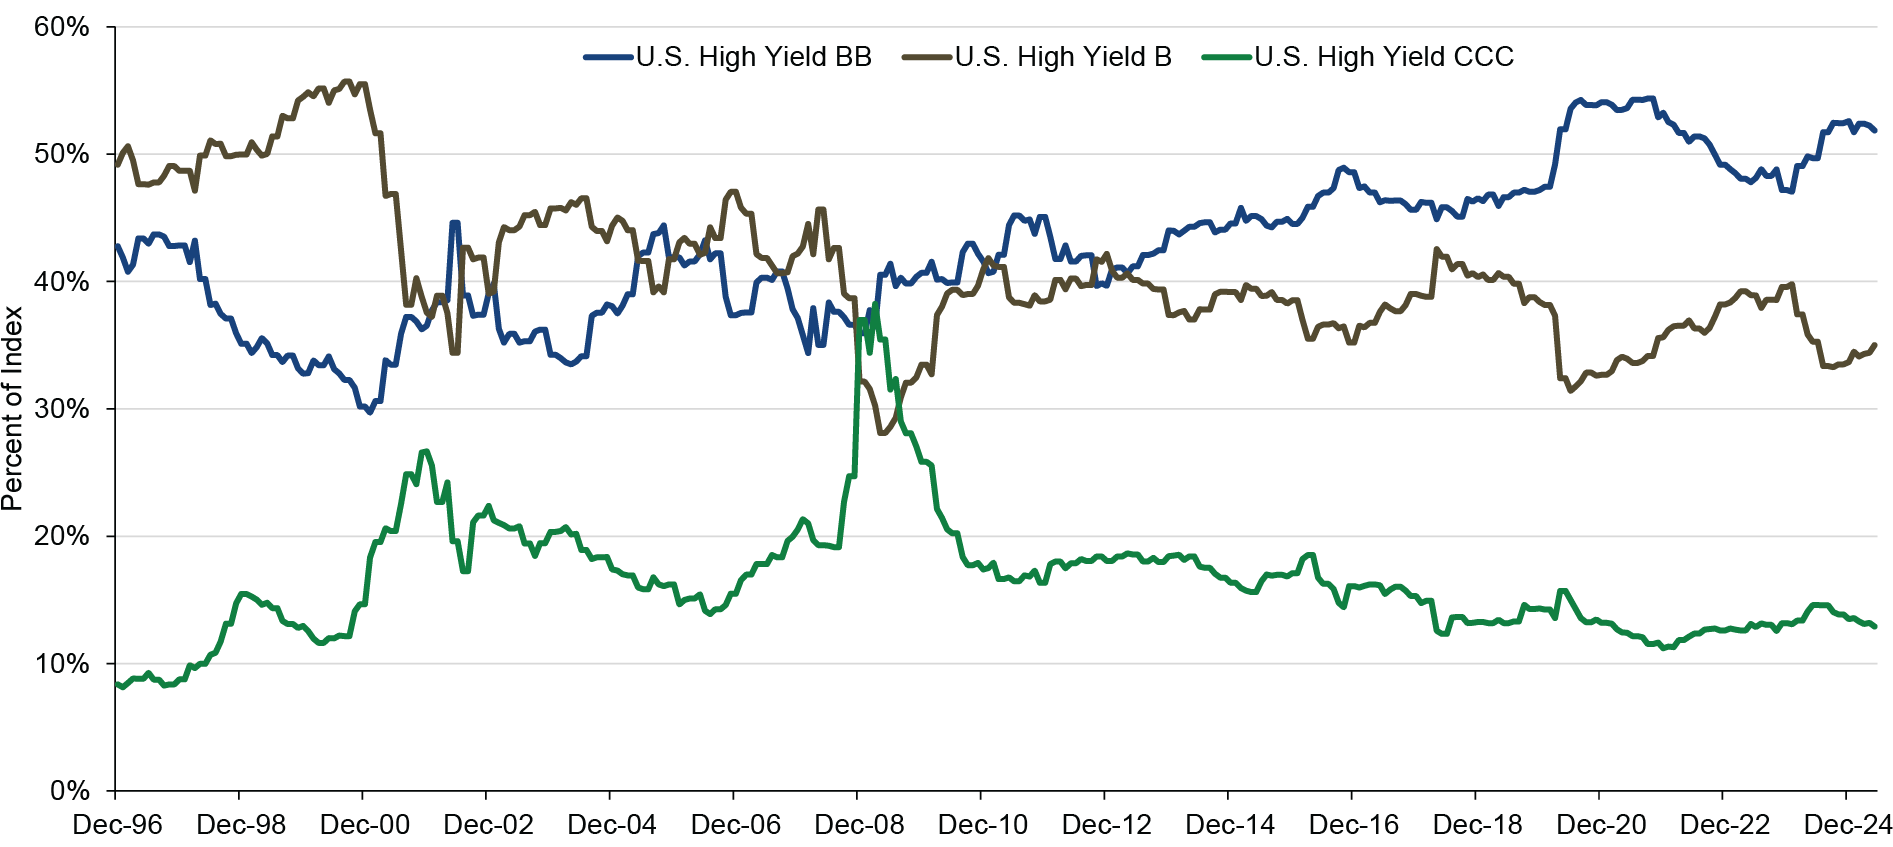
The credit quality of the high yield index has greatly improved over the past two decades, with a majority of the index shifting to higher-rated securities. Today over 50% of the high yield index is rated BB, while the proportion of the index in B- and CCC-rated securities has declined, as noted in Figure 1. This is important when thinking about potential industry default rates in a slowing economy, since defaults typically come from issues in the CCC bucket. With the index allocation to CCC near the lowest levels in 20 years, one may expect that default rates will not reach levels as seen in previous crises.

Figure 1. BB-Rated Proportion of the High Yield Index Near a Record High

ICE BofA U.S. High Yield Bond Index by credit quality, December 31, 1996–May 31, 2025

line chart showing ICE BofA U.S. High Yield Bond Index by credit quality, December 31, 1996–May 31, 2025
Source: ICE Data Indices, LLC. Data as of May 31, 2025. The historical data shown in the chart above are for illustrative purposes only and are not representative of any Lord Abbett product. Due to market volatility, the market may not perform in a similar manner in the future. Indexes are unmanaged, do not reflect the deduction of fees or expenses, and are not available for direct investment. 

Financial Metrics Suggest Strong Issuer Fundamentals

High yield issuers have maintained strong balance sheets, making them well prepared to withstand an economic slowdown. Leverage and coverage ratios, two metrics that are pivotal when assessing the financial strength of high yield companies, continue to be in favorable spots, as noted in Figure 2. Specifically, leverage continues to be lower than pre-pandemic levels, indicating a more manageable debt load for high yield issuers. Interest rate coverage, despite some migration lower, still remains at a solid level after coming from a much stronger starting point. In addition to the improved ratings mix for the index, these strong credit metrics are supportive of high yield spreads remaining below long-term average levels.

Figure 2. Healthy Fundamentals: Low Leverage and Solid Coverage Ratios

Last twelve months (LTM) debt to earnings before interest, taxes, depreciation, and amortization (EBITDA) ratio, March 31, 2008–March 31, 2025 (top panel) and EBITDA to interest expense ratio, March 31, 2008–March 31, 2025 (bottom panel)

bar chart showing Last twelve months (LTM) debt to earnings before interest, taxes, depreciation, and amortization (EBITDA) ratio, March 31, 2008–March 31, 2025
bar chart shwoing EBITDA to interest expense ratio, March 31, 2008–March 31, 2025
Source: JPMorgan as of March 31, 2025. Latest quarterly data available. For illustrative purposes only. Due to market volatility, the market may not perform in a similar manner in the future. Indexes are unmanaged, do not reflect the deduction of fees or expenses, and are not available for direct investment. The index data provided is not representative of any Lord Abbett product.

Building off of this base, earnings for high yield companies have continued to be resilient during this volatile stretch. According to J.P. Morgan, almost twice as many companies have beaten expectations for EBITDA than have missed expectations during the first quarter of 2025. And while there have been some questions around future guidance with uncertainty in tariff policies, the number of companies issuing positive or negative guidance was slightly biased toward positive, again proving the resiliency of fundamental strength in the high yield sector.

Lower Duration Relative to History

One notable trend in the high yield index is that it has gotten much shorter in duration over time, falling from an average effective duration of approximately 4.5 years in 2006 to historic lows at roughly 3.0 years today. On the other hand, the duration for the investment-grade index increased over the same period to roughly 6.5 years. One reason is that this follows relatively slow periods of new bond issuance within high yield markets in 2022 and 2023, leading to a dramatic decline in average maturity for the index. A shorter maturity and duration profile typically reduces default risk over the bond's life, assuming other factors remain constant, as the window for issuers to face uncertainty is smaller. This phenomenon has helped contribute to tighter overall spreads in the high yield market.

Figure 3. Shorter Duration Can Help to Mitigate Default Risk

ICE BofA Investment Grade Corporate Index and ICE BofA U.S. High Yield Index effective duration, May 31, 2005–May 31, 2025 

line chart showing ICE BofA Investment Grade Corporate Index and ICE BofA U.S. High Yield Index effective duration, May 31, 2005–May 31, 2025
Source: ICE Data Indices LLC. Data as of May 31, 2025. Duration is a measure of the sensitivity of the price of a bond or other debt instrument to changes in interest rates. It is expressed in years and indicates how much the price of a bond is expected to change with a 1% change in interest rates. Due to market volatility, the asset class depicted in this chart may not perform in a similar manner in the future. For illustrative purposes only and does not represent any specific portfolio managed by Lord Abbett or any particular investment. Indexes are unmanaged, do not reflect the deduction of fees or expenses, and are not available for direct investment.

Starting Yield and Lower Dollar Price Offer Attractive Entry Point

Starting yields for the index have remained elevated, offering higher levels of income to help boost returns. This is notable when looking at prior periods, as yields have typically been lower when spread levels have been this tight. As represented by the yield-to-worst (YTW) of the high yield index, starting yields have been much higher in the last three years, as noted in Figure 4, which was a direct reflection of the elevated interest-rate environment that began in 2022.

Figure 4. Historically, Elevated Yields Represented an Attractive Entry Point

ICE BofA U.S. High Yield Index option-adjusted spreads (OAS), May 31, 2001–May 31, 2025 (top panel), and ICE BofA U.S. High Yield Index YTW, December 31, 2014–May 31, 2025 (bottom panel)

line chart showing ICE BofA U.S. High Yield Index option-adjusted spreads (OAS), May 31, 2001–May 31, 2025
line chart showing  ICE BofA U.S. Index YTW, December 31, 2014–May 31, 2025
Source: ICE Data Indices LLC. Data as of May 31, 2025. The OAS is a measurement used in fixed income securities to determine the spread between the security rate and the risk-free rate of return, adjusted to account for any embedded options. YTW is a financial metric used to evaluate the lowest possible yield that an investor can receive on a bond without the issuer defaulting. It is calculated based on the earliest call date and is used to assess the worst-case scenario for yield. Forward cumulative index returns are not annualized and were calculated when the index YTW was above 7%. No investor achieved these returns. Past performance is not a reliable indicator or guarantee of future results. Due to market volatility, the asset class depicted in this chart may not perform in a similar manner in the future. For illustrative purposes only and does not represent any specific portfolio managed by Lord Abbett or any particular investment. Indexes are unmanaged, do not reflect the deduction of fees or expenses, and are not available for direct investment.

This is important because the higher starting yields offer a much better entry point. If we look back at the history of the index, when starting yields were above 7%, the index experienced strong cumulative forward returns of 8.8%, 16.8%, and 25.0% on a one-, two- and three-year basis, respectively. This historical performance underscores the benefits of investing in high yield when yields are at these levels.

And while spreads are below long-term averages, convexity in the high yield market has improved as prices have drifted below par value as a reflection of the higher yield environment. This has added to the potential for price appreciation to contribute toward total return, as well as offer a better cushion for investors buying below par bonds, which is generally rare when credit spreads have been at these tight levels. Additionally, issuers may elect to refinance upcoming debt before the listed maturity date, adding to potential total returns as the pull-to-par effect is realized over a shorter window.

Conclusion: Looking Ahead

Markets have shown modest signs of weakness in the first half of 2025, as notably softer economic data, worries of growth contraction, and policy uncertainty dragged on consumer sentiment. Despite these concerns, high yield returns have been positive, and we continue to believe that the sector can provide attractive relative returns for the remainder of the year. However, it is important to note that patience is key and being selective in adding risk is crucial, given the potential for idiosyncratic credit events to erode returns. Within our strategies, we remain selective in our positioning and continue to be vigilant about potential headwinds that could cause spreads to move wider, including signs of cracks in labor markets, tariff repercussions, and the U.S. Federal Reserve’s rate and fiscal policies.