In his paper, “The Quality Dimension of Value Investing,” Robert Novy-Marx evaluates the importance of incorporating quality metrics into traditional value investing strategies.1 Through the lens of the investment processes of Benjamin Graham, Jeremy Grantham, Joel Greenblatt, and his own method, Novy-Marx makes the case that a quality focus, coupled with traditional value metrics and even momentum measures, can be the foundation of an effective investment strategy. This approach can potentially augment long-term returns and better distinguish “bargain stocks,” those that are undervalued based on the market’s misperception of their appreciation potential, as opposed to “value traps,” those that are cheap for a good reason.

A value trap refers to a stock that appears undervalued based on traditional valuation metrics but is actually a poor investment. These stocks often attract investors with the promise of significant upside potential, only to underperform due to underlying issues such as declining business fundamentals, poor management, or adverse industry conditions.

The primary risk of value traps is that investors may hold onto these stocks for extended periods, anticipating a turnaround that never materializes. This results in capital being tied up in underperforming investments, which could have been allocated to more promising opportunities. Additionally, the persistence of negative factors can lead to further declines in stock prices, exacerbating losses and negatively impacting overall portfolio performance.

Thus, an investment strategy that can avoid selecting value traps has the potential to achieve better downside protection, by avoiding poor performing cheap stocks, and better upside capture, by putting stagnant money to work in appreciating “bargain stocks.”

Locating Value Traps

In 1992, Eugene Fama and Kenneth French released their influential research on how to define value companies, growth companies, and the high-minus-low (HML) factor, which showed, historically, how value companies had outperformed growth companies, i.e., the value premium.2 Value companies were defined as companies with lower price-to-book values (P/B), while growth companies had higher P/B ratios. When Fama and French released that data, they probably did not anticipate that over 30 years later, the evolution of the global economy would lead to asset-light businesses—those that could generate profits with less capital invested in property, plant, and equipment—displacing the status quo of traditional value investing and possibly calling the major finding of their research into question.

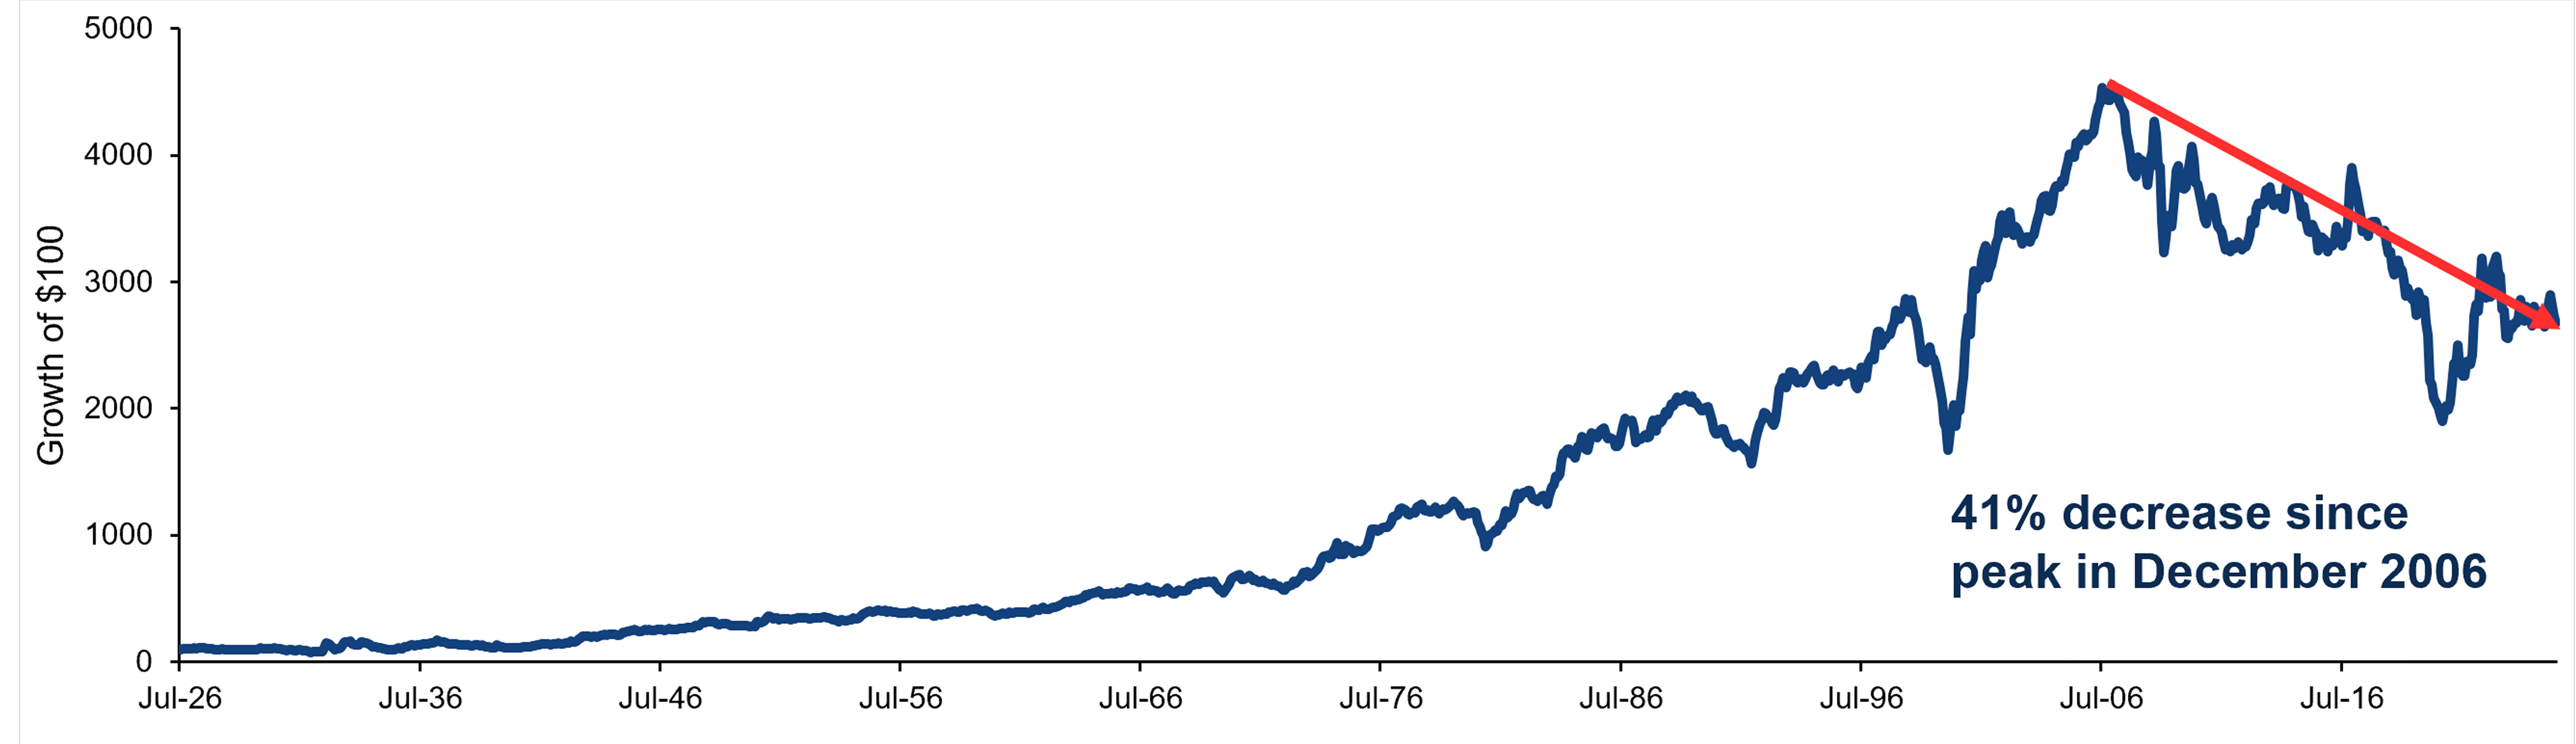
And yet, P/B is still the foundation for benchmark value style indexes such as Russell, MSCI, and Wilshire. As a result, many still utilize this formulaic approach in any value analysis. When the historical HML data was released, it showed that the value premium was a consistent method for targeting alpha. Shortly after that, cracks began to show in the outperformance, and the factor had a 40% decrease in performance from its peak in December 2006. (See Figure 1.)

Figure 1. The Fama-French “HML Factor” Has Declined over the Past 20 Years

Growth of $100 invested on June 30, 1926, based on return differential of value and growth stocks (see below), through June 30, 2025

Line Chart Showing Growth of $100 invested on June 30, 1926, based on return differential of value and growth stocks (see below), through June 30, 2025
Source: Ken French data library at Dartmouth as of 6/30/2025. Monthly data for the indicated period. HML factor refers to the difference in performance between value stocks, with lower price-to-book values (P/B), while growth companies had higher P/B ratios; it is one of the factors in the Fama-French three-factor model, developed by economists Eugene Fama and Kenneth French to explain stock returns.
Past performance is not a reliable indicator or guarantee of future results. For illustrative purposes only and does not represent any specific portfolio managed by Lord Abbett or any particular investment. Indexes are unmanaged, do not reflect the deduction of fees and expenses, and are not available for direct investment.

While some of this decline is rightfully attributed to the post-2008 recession era of deregulation and artificially low interest rates, which led to one of the longest growth rallies in history, the deterioration of the effectiveness of P/B is evident.

Where, then, should value investors focus their attention? Our goal in this paper is to dissect this P/B-related data further to locate and determine ways to avoid the value traps that have created more volatility and less downside protection in what has been traditionally considered a more conservative equity investment strategy.

By focusing on P/B for large- and mid-sized companies in the United States since 1992, we can split the universe into equal-weight quintiles (see Figure 2) and see that the cheapest (bottom) quintile not only had the lowest returns, but the highest volatility (as measured by standard deviation) within the group. 

Figure 2. The Cheapest Stocks Have Been the Worst Performing—and Most Volatile

Returns for quintiles of the Russell 1000® Index based on price-to-book value for the period December 31, 1991–August 29, 2025

Chart showing Returns for quintiles of the Russell 1000® Index based on price-to-book value for the period December 31, 1991–August 29, 2025
Source: FactSet as of 08/31/2025. Data is based on returns of equal-weighted quintiles of stocks within the Russell 1000 Index® that were sorted by price to book and rebalanced annually at the end of March, ranging from the bottom quintile of Q1 (“Cheapest) to the top quintile of Q5 (“Most Expensive”).
Past performance is not a reliable indicator or guarantee of future results. For illustrative purposes only and does not represent any specific portfolio managed by Lord Abbett or any particular investment. Indexes are unmanaged, do not reflect the deduction of fees and expenses, and are not available for direct investment.

While many of the companies in the bottom quintile can appreciate and move up in value to higher quintiles over time, other companies do the opposite and remain stagnant or fall out of the universe. These companies are the ones we would broadly define as value traps.

Isolating Value Traps

As mentioned earlier, Novy-Marx makes the case that an investment approach oriented toward quality, specifically gross profitability, could lead to outperformance compared to traditional value. Our goal isn’t to solely target companies with high profitability, as that may uncover names that may be “growthier” in nature instead of value oriented. Instead, we believe that companies that generate higher cash flows to sustain their production and grow their capital structure, are less likely to fall into the same stagnation or distress that we expect value traps to experience.

As an example, take two companies in different sectors with vastly different business models and cash flow consistency. On one hand, Alcoa is a major aluminum producer, and while it is a global leader in its industry, the company produces a commodity-like product and is susceptible to underlying commodity price volatility that it cannot always mitigate. This makes its earnings highly unpredictable. In fact, based on data from FactSet as of August 31, 2025, Alcoa’s free cash flow is flat versus 10 years ago, despite having material swings from negative to positive in any given year. The share price is also basically flat over that time.

On the other hand, Microsoft is a technology leader with diversified revenue streams that have benefited from consistent strategic investment and innovation, allowing the company to continue to “widen its moat,” which has supported consistent share price appreciation over the long term.

Figure 3. Comparing Two Major Businesses Shows How Consistent Free Cash Flow Is Reflected in Stock Performance

Free cash flow (mil. US$) and stock price (US$) data for the calendar years 2014-2024

Bar Chart and line chart showing Free cash flow (mil. US$) and stock price (US$) data for the calendar years 2014-2024
Source: FactSet as of 08/31/2025. LHS = Left-hand side. RHS = Right-hand side. Most recent calendar year data available. Past performance is not a reliable indicator or guarantee of future results. For illustrative purposes only and does not represent any specific portfolio managed by Lord Abbett or any particular investment. Mentions of specific companies are for reference purposes only and are not meant to describe the investment merits of, or potential or actual portfolio changes related to, securities of those companies.

Guided by the examples above, we want to avoid companies that aren’t generating sufficient cash flow and thus potentially avoid certain value traps. If we continue to focus on the bottom quintile of securities based on P/B that was highlighted earlier, we can emphasize a metric that looks at the quality of their earnings, operating cash flow to EBITDA (OCF/EBITDA). Companies with lower OCF/EBITDA tend to be struggling to maintain the necessary cash flow to sustain the longevity of their business models. If we remove the bottom quintile, quartile, and tertile of this observed group, we can see that absolute performance of the universe increases drastically. Avoiding companies that cannot sustain their business models helps exclude those that can cause a drag on overall performance due to price stagnation or decline. 

Figure 4. Avoiding Weak Cash Flow Conversion Has Resulted in Better Returns

Returns for designated quintile of the Russell 1000® Index based on price-to-book value and defined sub-groups for the period December 31, 1991–August 29, 2025

Chart showing Returns for designated quintile of the Russell 1000® Index based on price-to-book value and defined sub-groups for the period December 31, 1991–August 29, 2025
Source: FactSet as of 08/31/2025. Data is based on returns of equal-weighted quintiles of stocks within the Russell 1000® Index that were sorted by price to book and rebalanced annually at the end of March; the data displayed here relate to the bottom (“Cheapest”) quintile. This group was then filtered by removing the bottom 20%, 25%, and 33%, respectively, of stocks based on their operating cash flow/EBITDA ratio. For illustrative purposes only. Past performance is not a reliable indicator or guarantee of future results. Does not represent any specific portfolio managed by Lord Abbett or any particular investment. Indexes are unmanaged, do not reflect the deduction of fees and expenses, and are not available for direct investment.

Efficient cash flow is just one piece of the puzzle in choosing quality investments, in our view. Companies must be able to replicate strong cash flow over multiple periods so that they can continue to reinvest in their processes. In our view, that replication reflects strong management and operational consistency. Conversely, companies can be negatively affected by poor management decisions, earnings manipulation, or unstable profitability—all factors that can lead to higher levels of volatility.

We believe there is an effective way to track this long-term strength. Return on invested capital (ROIC), a ratio that measures how effectively a company is using all of its capital to generate profit, is one method highlighted by Novy-Marx’s research. All other things being equal, if a company is consistently generating strong ROIC, then we believe there is a high likelihood that it is avoiding the pitfalls associated with value traps.

For a real-world example, look at the relative performance of the two companies featured in Figure 5. In the case of Lands’ End, Inc., a well-known apparel retailer, the trend in ROIC over the observed period would position it as an example of a value trap. Over the last decade, we’ve seen an inconsistent ebb and flow of the company’s ROIC, and Lands’ End hasn’t been able to expand its market share. As a result, the stock’s performance has been quite weak.

Compare this to EMCOR Group, Inc., a leader in electrical and mechanical construction services, which has shown a strong history of increasing ROIC. This has allowed the company to make smart acquisitions, grow its market share, and withstand the headwinds that many companies faced during the global pandemic in 2020. This track record has resulted in consistently strong stock performance for EMCOR, in our view.

Figure 5: ROIC: Two Different Performance Outcomes

Return on invested capital (%) and stock price (US$) data for the calendar years 2014-2024

Line Chart and Bar Chart showing Return on invested capital (%) and stock price (US$) data for the calendar years 2014-2024
Source: FactSet as of 08/31/2025. LHS = Left-hand side. RHS = Right-hand side. Most recent calendar year data available. Past performance is not a reliable indicator or guarantee of future results. For illustrative purposes only and does not represent any specific portfolio managed by Lord Abbett or any particular investment. Mentions of specific companies are for reference purposes only and are not meant to describe the investment merits of, or potential or actual portfolio changes related to, securities of those companies.

The examples above demonstrate why we want to make sure companies are reinvesting in their businesses over the course of a market cycle and can “right the ship” when there are short-term disruptions. To reflect this factor in our analysis of the cheapest quintile of companies, we can further dissect the universe by avoiding companies that have a lower five-year compound growth rate in ROIC, as we want to keep only those companies with stable-to-increasing ROIC. Using the same exclusion process as the previous OCF/EBITDA excluded universes, we can see a substantial drop-off in each group’s volatility, which leads to better risk-adjusted performance, as measured by the Sharpe ratio. 

Figure 6: Putting it All Together: For Value Equities, Emphasizing Cash Flow and ROIC Has Resulted in Better Returns with Lower Volatility

Data for the period the period December 31, 1991–August 29, 2025

charts showing Data for the period the period December 31, 1991–August 29, 2025
Source: FactSet as of 08/31/2025. Data is based on returns of equal-weighted quintiles of stocks within the Russell 1000® Index that were sorted by price to book and rebalanced annually at the end of March; the data displayed here relate to the bottom (“Cheapest”) quintile. This group was then filtered by removing the bottom 20%, 25%, and 33%, respectively, based on operating cash flow/EBITDA, followed by removing the bottom 20%, 25%, and 33%, respectively, based on 5-year compound growth rate of return on invested capital. For illustrative purposes only. Past performance is not a reliable indicator or guarantee of future results. Does not represent any specific portfolio managed by Lord Abbett or any particular investment. Indexes are unmanaged, do not reflect the deduction of fees and expenses, and are not available for direct investment.

By taking a critical look at the cheapest quintile universe and avoiding companies that struggle to convert revenue into cash that is reinvested effectively, we can potentially create substantial alpha with much lower volatility. Although there is still a higher level of volatility compared to the other P/B quintiles, the substantial increase in returns highlights the upside potential of investing in these “bargain stocks.”

Conclusion

To avoid value traps, we believe it’s imperative to employ a consistent and active investment process that emphasizes relative valuation, but also incorporates other factors, particularly a company’s business quality, historical track record, and current fundamental trajectory or stability. Quality companies—those that generate excess free cash flow and demonstrate thoughtful capital deployment—should find themselves able to evolve through transitory hurdles. We believe return on invested capital is a crucial indicator of a company’s resilience. Patience and assessing fundamental momentum are also key, as businesses experiencing financial headwinds may take time to recover. By focusing on these factors, investors can potentially minimize the risk of value traps and create the conditions for long-term outperformance.