Forecasting interest rates was undoubtedly a difficult task in 2024. It usually is, with forecasters getting the six-month direction of rates correct only about 55% of the time, and with about 55 basis points (bps) in average forecasting error over that period.1 But the past year has been especially cruel to forecasters, many of whom rely on extrapolating recent trends to longer-term trends. During 2024, the trend was not a friend, and market expectations for U.S. Federal Reserve (Fed) rate cuts gyrated wildly and led to a continuation of elevated levels of volatility across the curve, which is measured by the ICE BofA Merrill Lynch Option Volatility Estimate (MOVE) index.
Figure 1. Bond Market Volatility Continued in 2024
ICE BofA MOVE index, June 1, 2014-December 31, 2024
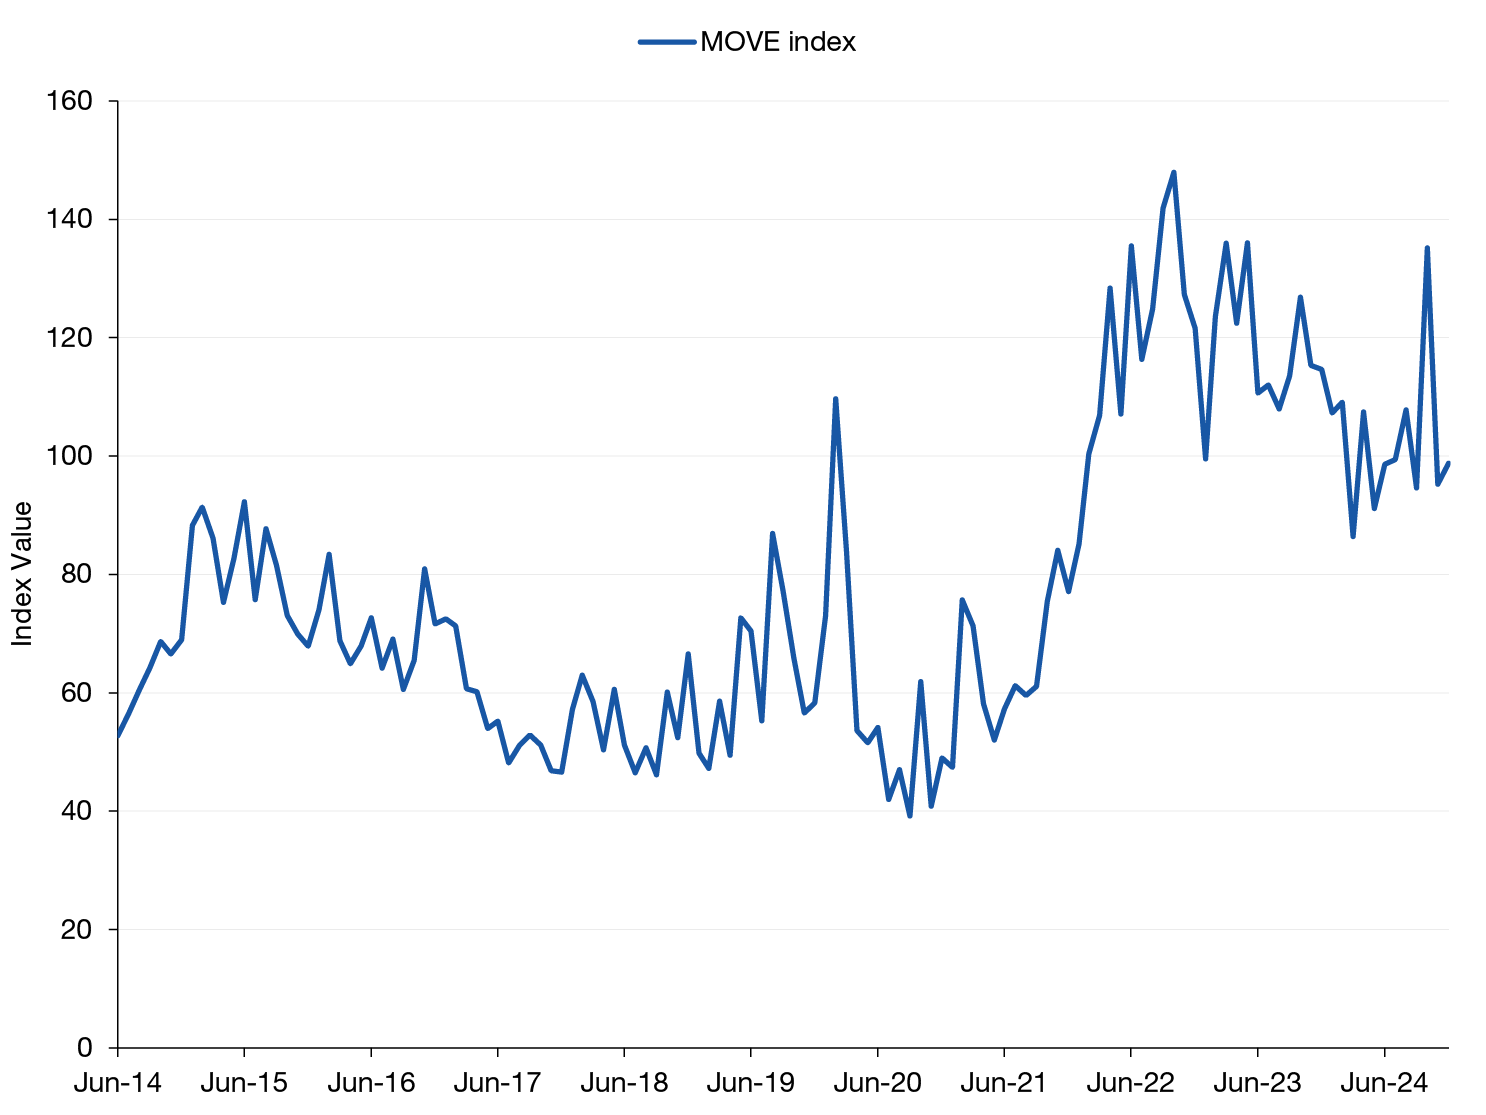
Source: Bloomberg. Data as of December 31, 2024. The MOVE index is a measure of the volatility within the U.S. Treasury bond market. For illustrative purposes only and does not represent any specific portfolio managed by Lord Abbett or any particular investment. Indexes are unmanaged, do not reflect the deduction of fees or expenses, and are not available for direct investment.
When markets work correctly, uncertainty brings compensation, and today’s rate levels are indeed attractive, reflecting the newfound appreciation of the risk in interest rates. Is it enough? Below, we outline a framework for estimating the reasonable ranges for short- and long-term rates, which in turn can help guide active rate positioning and asset allocations. It’s a straightforward framework, using the building blocks of rates, the history of where those pieces have been over time, and an assessment of the current market regime to estimate where the pieces should be today.
Estimating the Terminal Rate
First, we need to estimate where the “terminal” short-term rate should be. That’s the level of short-term rates that would neither expand nor contract the economy but allow steady “trend” growth. With U.S. gross domestic product (GDP) growing at around 3% in real terms and inflation getting closer over most of 2024 to the Fed’s 2% target, it’s reasonable to assume the Fed should stay near the neutral terminal rate in order to maintain this goldilocks level of growth and inflation. The problem is no one knows where that terminal rate is exactly. The market has adjusted its expectations for the 2025 year-end fed funds rate substantially and then back again several times during 2024, as shown in Figure 2. Also shown is that the Fed members have adjusted and then reversed their own expectations of where they might be on fed funds by the end of 2025, currently matching the market’s expectations. What doesn’t match is the market’s expectation that the 2025 year-end rate is the terminal short-term rate, while the Fed members think, on average, it will fall to around 3% over the next few years.
Figure 2. Market Versus Fed Terminal Rate Outlook Has Diverged
Implied overnight fed funds rate based on fed fund futures, the Fed’s median year-end 2025 fed funds rate projection, and the Fed’s median long-term rate projection, August 8, 2024-December 31, 2024
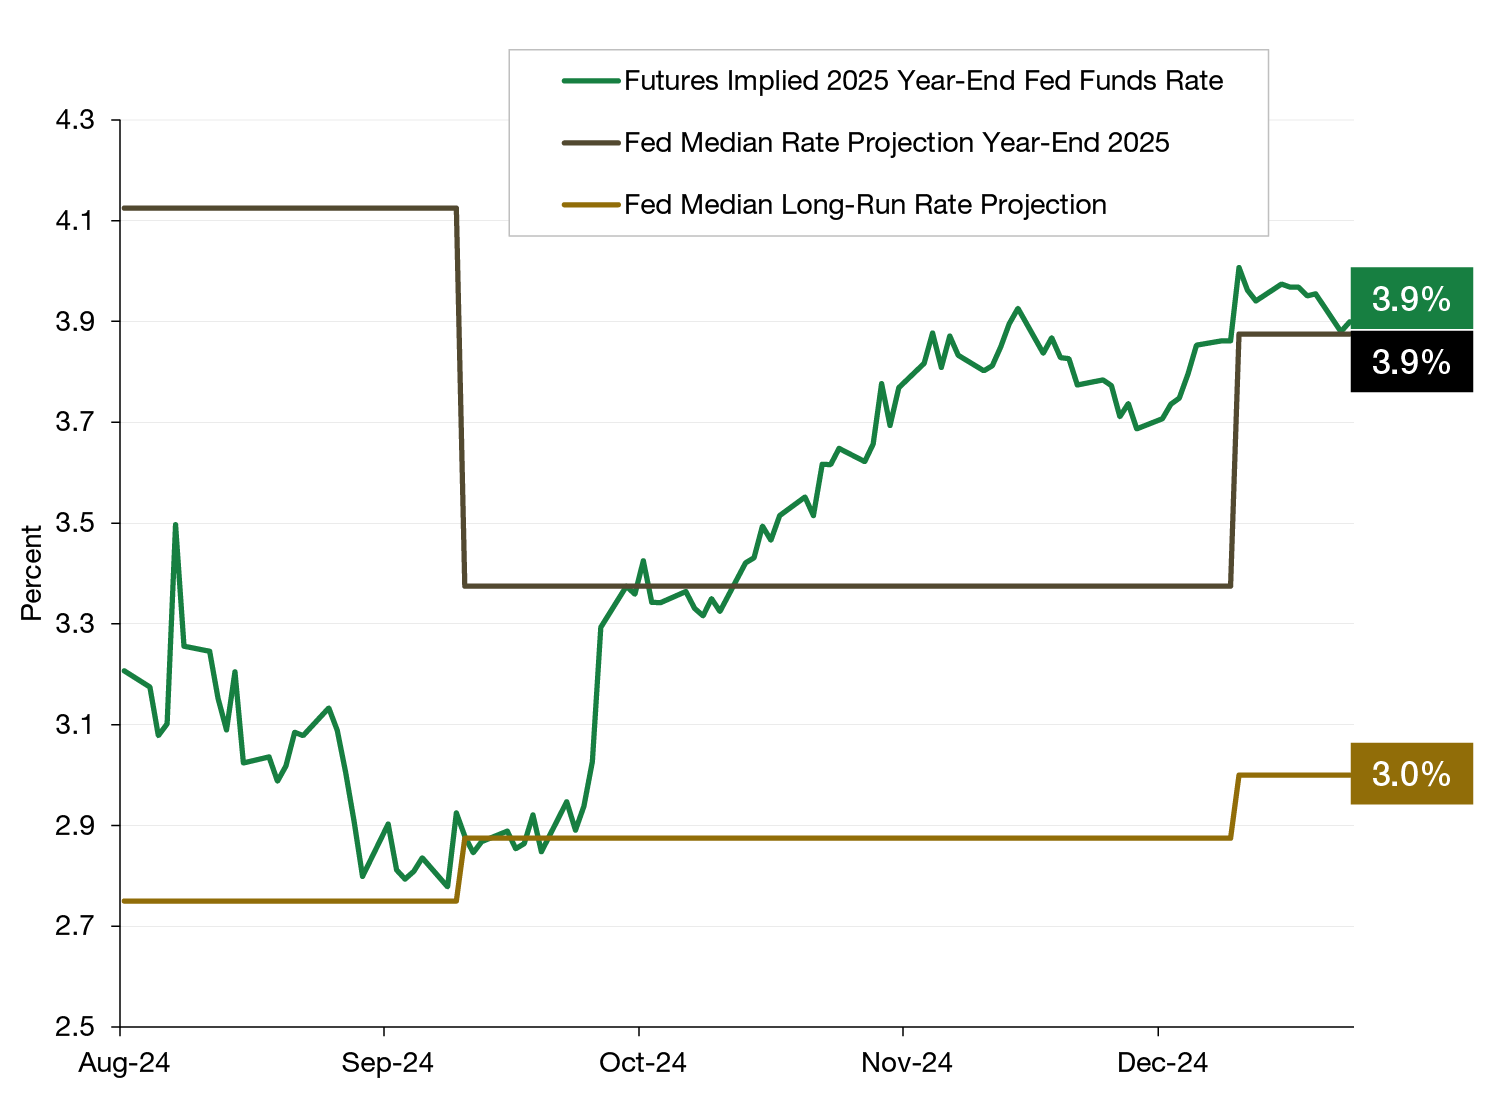
Source: Bloomberg. Data as of December 31, 2024. The prices of federal funds futures contracts indicate what market participants anticipate the fed funds rate will be at various future dates, which is the interest rate at which banks lend to each other overnight. For illustrative purposes only and does not represent any specific portfolio managed by Lord Abbett or any particular investment. Indexes are unmanaged, do not reflect the deduction of fees or expenses, and are not available for direct investment.
Who is correct in this debate is important for investors’ fixed income allocations. Because of the Fed’s dual mandate of price stability and maximum employment, the neutral short-term rate level, or terminal rate, should approximate inflation expectations, and then with some extra “real” rate on top of that to make credit costly enough to keep prices and growth expanding at a moderate rate.
Estimating Inflation
The first step in estimating the terminal short-term rate is estimating where we should expect inflation to settle. Looking at the long-run history of the Core Personal Consumption Expenditure (PCE) Index, we can see that in the last 20- and 30-year periods up to the COVID pandemic, the Fed has earned its credibility by getting very close to a long-term average of 2%, shown in Figure 3.
The Fed did allow inflation to overshoot prior to the great financial crisis (GFC) and notoriously could not get inflation up to 2% post-GFC, despite a number of creative quantitative easing attempts such as “Operation Twist” launched in the second half of 2011. In this post-COVID pandemic period, we believe there are enough well-documented drivers of inflation both from the demand and supply side that we are likely to remain modestly above the 2% target rather than below it. These include proposed policy measures of the incoming administration around tax cuts, decreased immigration, and increased tariffs as well as long-term drivers such as deglobalization of supply chains, single family housing shortages in developed countries, and a supply-and-demand mismatch in the labor market as populations age. There are intermediate and long-term mitigating factors with a savings glut and artificial intelligence (AI) productivity gains chief among them.
On balance, we see good reason to trust the Fed’s ability to control inflation over the long term but also see that being a tough battle over the next few years. The market may have this one well targeted, with the current five-year inflation swap trading close to 2.5%, a level we find fair.
Figure 3. Inflation History and Recent Market Pricing Point to Fed’s Capability
Core PCE YoY, January 1, 1971-November 30, 2024 (top), and U.S. five-year, zero-coupon inflation swap rate, July 21, 2004-December 31, 2024 (bottom)
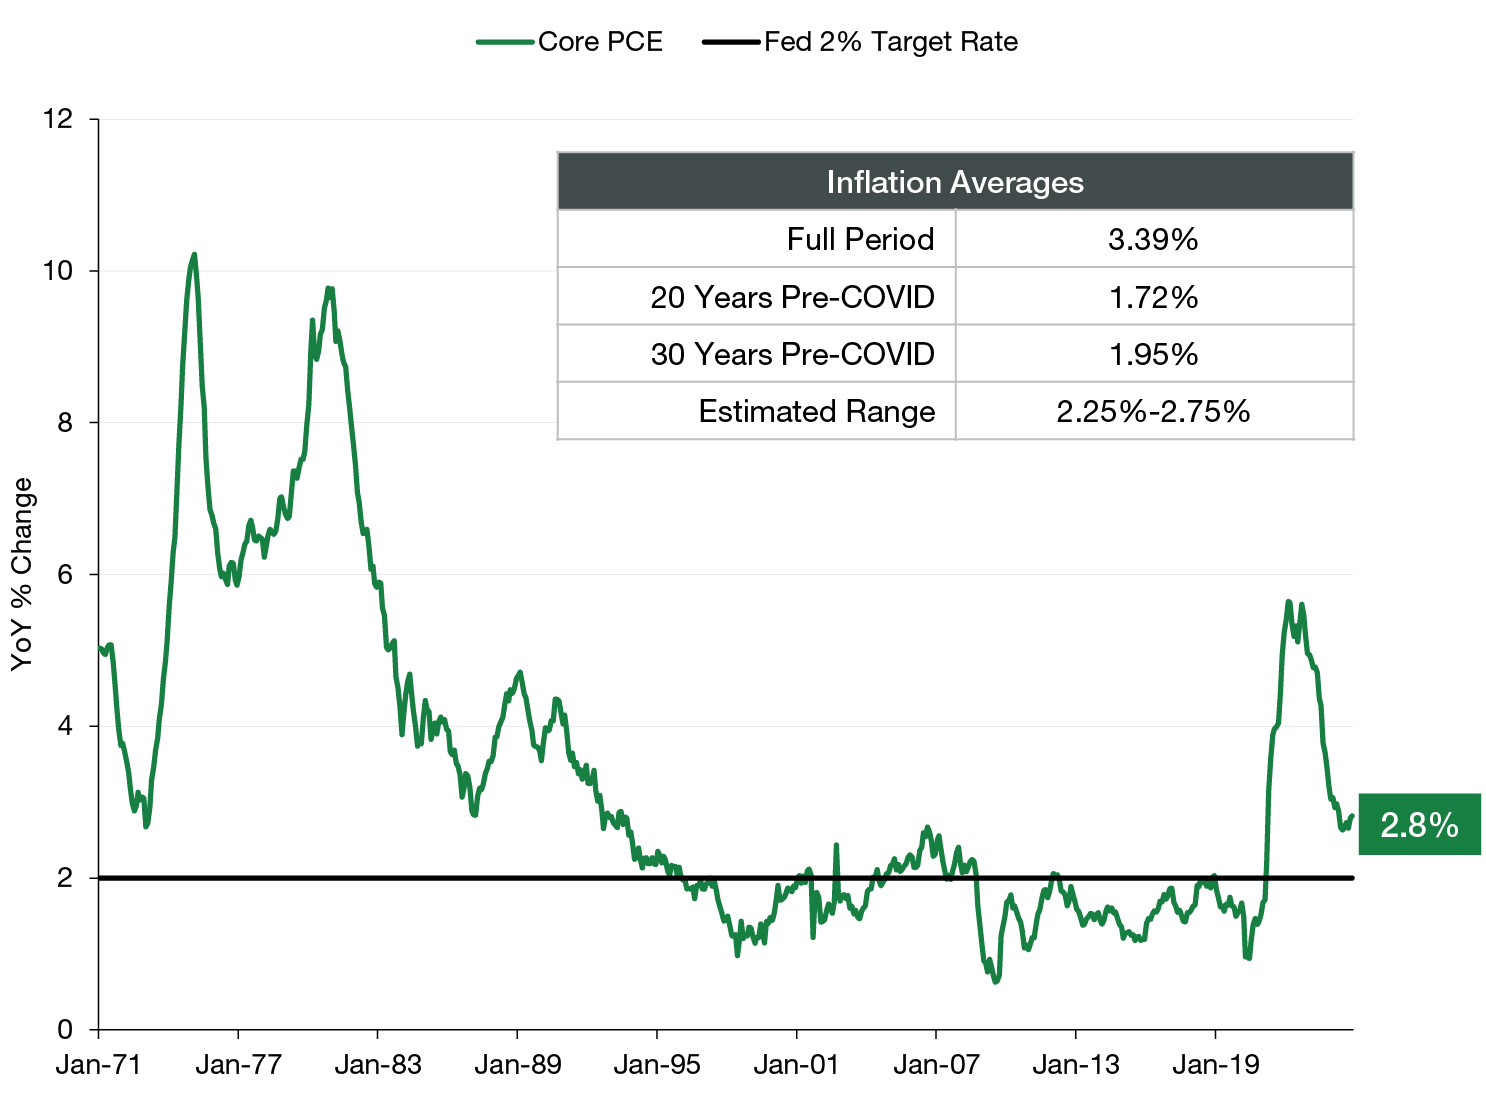
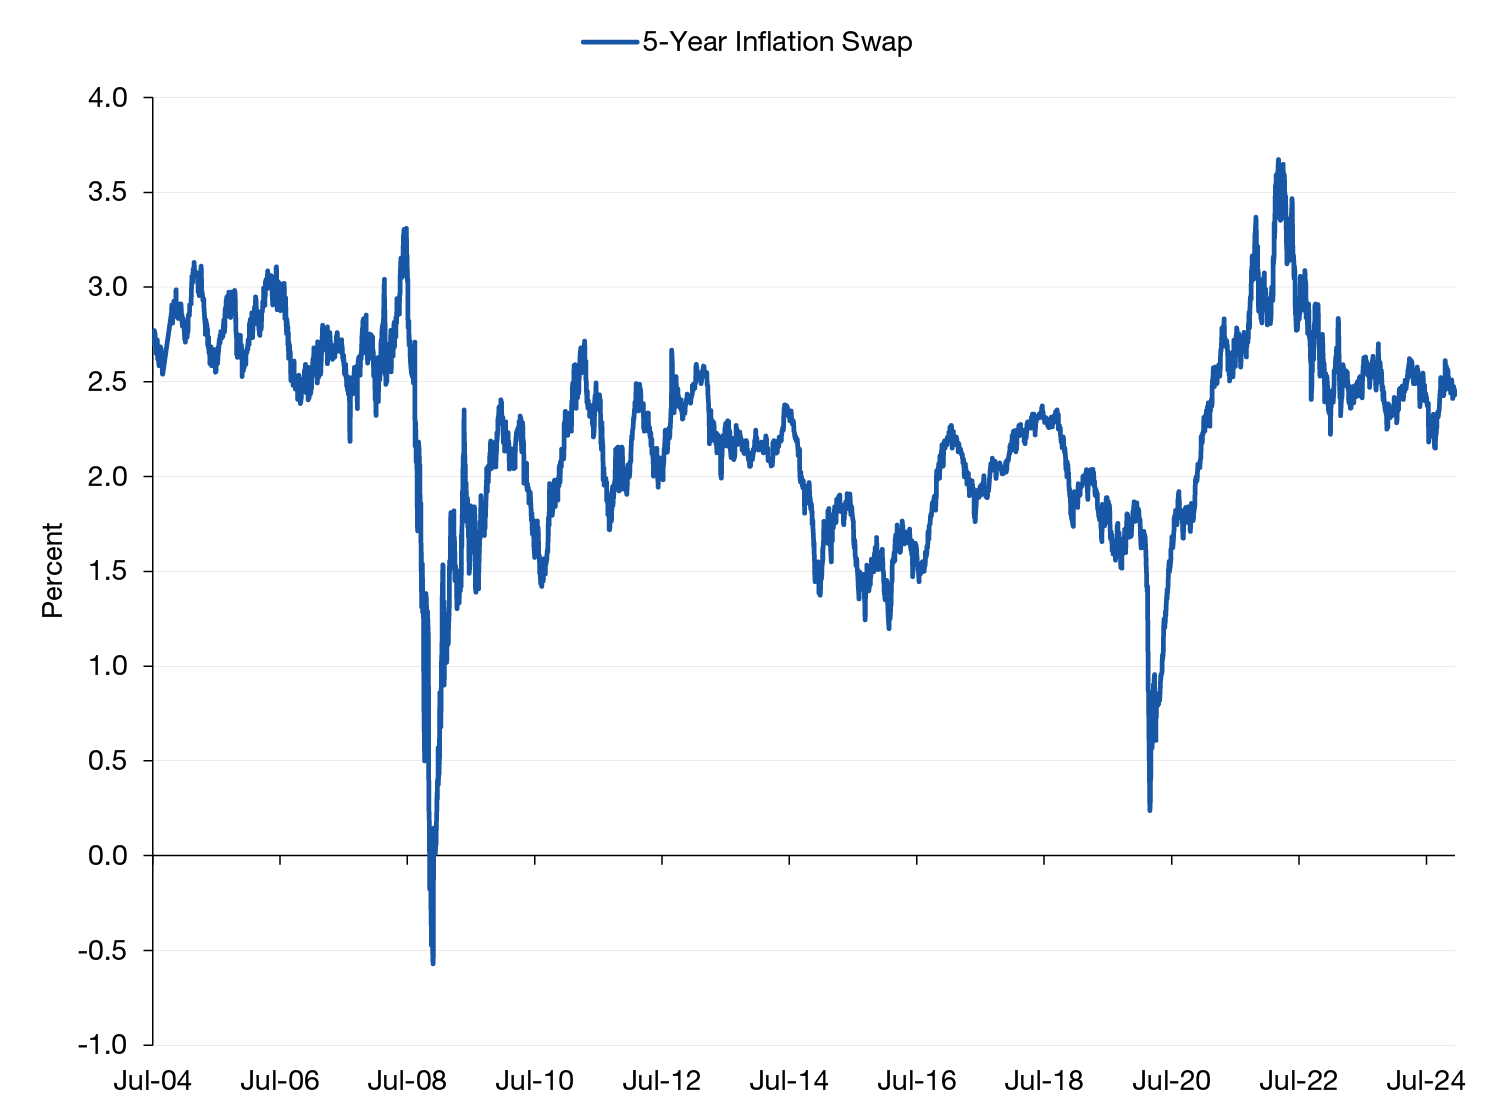
Source: Bloomberg. Data as of November 30, 2024 (top) and December 31, 2024 (bottom). Most recent data available. YoY=year-over-year. Pre-COVID 20-year and 30-year average periods are February 29, 2000-January 31, 2020, and February 28, 1990-January 31, 2020, respectively. Core PCE is a measure of the prices paid by consumers for goods and services, excluding the more volatile categories of food and energy. A zero-coupon inflation swap is a type of financial derivative used to hedge or speculate on inflation. In a zero-coupon swap, cash flows are exchanged at maturity. For illustrative purposes only and does not represent any specific portfolio managed by Lord Abbett or any particular investment. Indexes are unmanaged, do not reflect the deduction of fees or expenses, and are not available for direct investment.
Estimating the Neutral Real Rate
The real rate (calculated by subtracting inflation from the fed funds rate) has averaged 129 bps since 1971, but there are clear regime shifts in the historical data. For most of the Paul Volker Fed and even in the early Alan Greenspan era (August 1987 was the changeover) keeping inflation down was a primary goal, which, combined with a strong economy, led to substantial positive real rates. Conversely, in the post-GFC period real rates were consistently negative as growth stagnated and globalization kept prices falling on many goods. More balanced periods like 1990-2007 had a 191-bps average real rate but included a fair amount of fluctuation between positive and negative values.
Today, the sustainable real rate is hotly debated with the Fed favoring lower values after a 2015 study that pegged the neutral real rate then at 0.5%. The recent experience of real rates over 2% has brought inflation down, but real growth continues at strong levels, suggesting the true “neutral” real rate may be nearer where we are today than 0.5%, though recent growth is likely influenced by significant fiscal deficit spending. With risks balanced between a higher growth and inflation paradigm post-COVID pandemic and the familiar forces of secular stagnation due to oversupply of savings and productive capacity, we believe the neutral real rate is likely lower than 2% but higher than 0.5%, and currently see a range of 1.0%-1.75% as reasonable.
Figure 4. History Suggests a Real Rate Near Today’s Levels
Real rates January 1, 1971-November 30, 2024
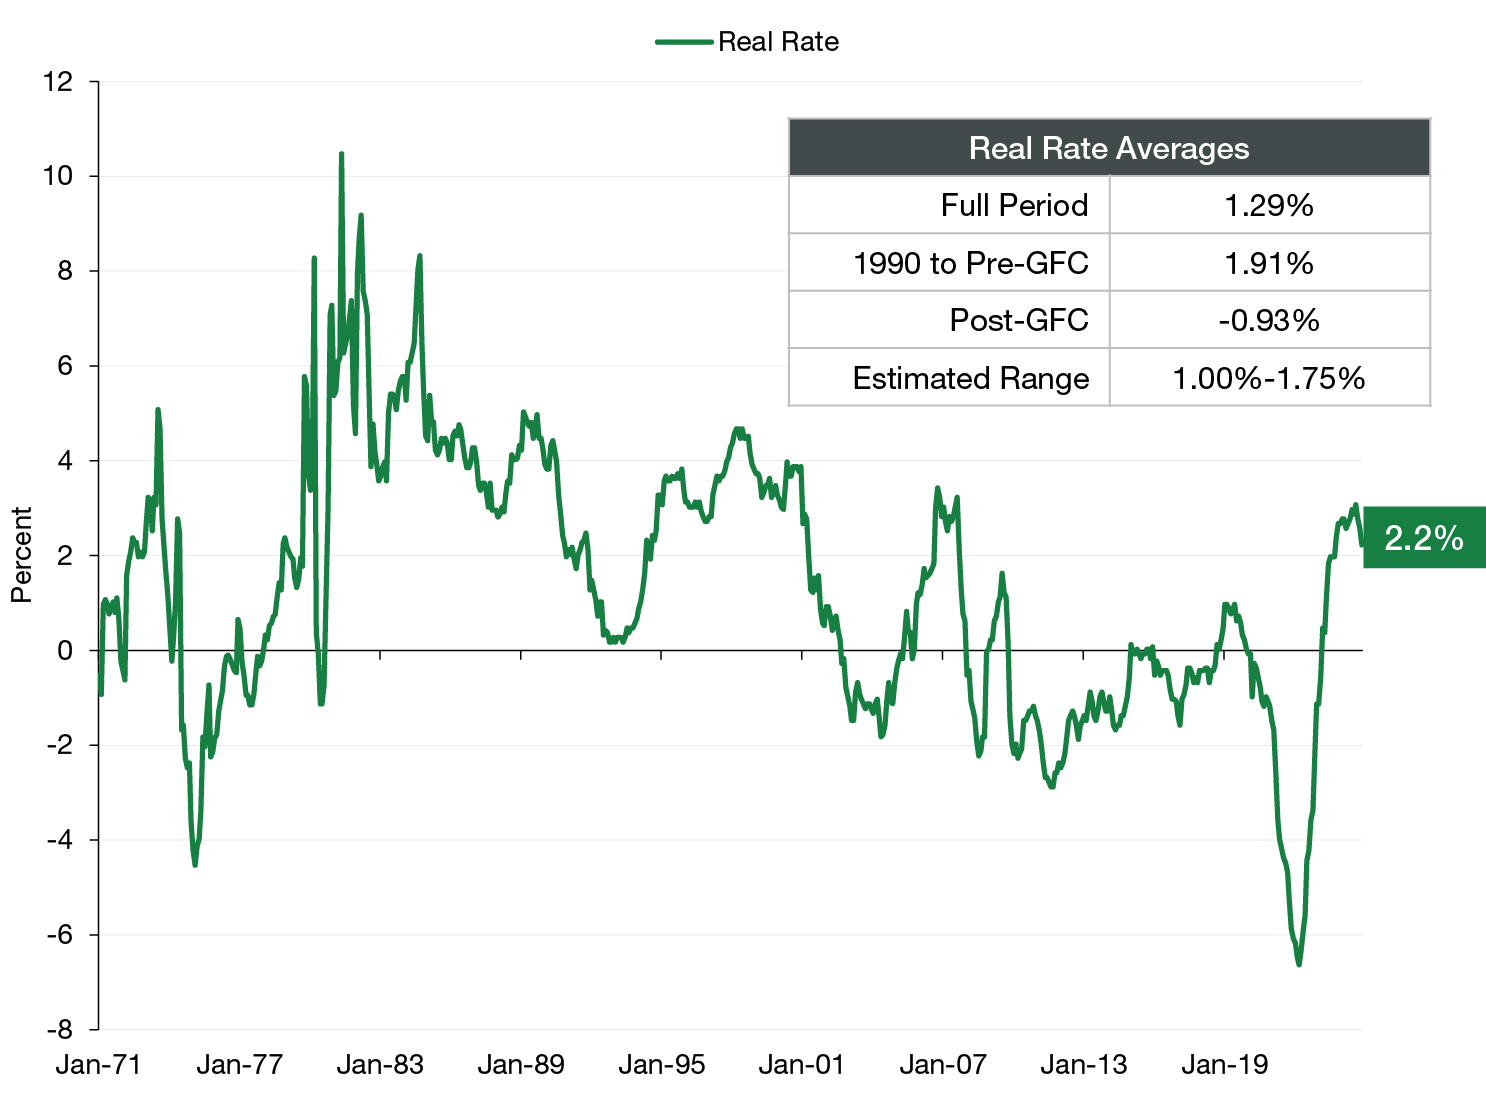
Source: Bloomberg. Data as of November 30, 2024. Most recent data available. Pre-GFC and Post-GFC periods are January 1, 1990-December 31, 2007, and January 1, 2008-November 30, 2024, respectively. The real rate is calculated by taking the fed funds target rate and subtracting the inflation rate based on the PCE index. For illustrative purposes only and does not represent any specific portfolio managed by Lord Abbett or any particular investment. Indexes are unmanaged, do not reflect the deduction of fees or expenses, and are not available for direct investment.
That leaves the terminal short-term rate midpoint estimate at 2.5% inflation plus a 1.375% real rate, the midpoint of the estimated range, to land right at 3.875%. In our estimation, then, the market is providing a better estimate of this than the Fed, and the Fed may have an anchoring bias in its expectations for inflation and the real rate to the recent past rather than the full set of regimes we’ve explored.
Estimating Term Premium
The next question is: Where should longer-term rates be? A simple way to look at this is just the spread between fed funds and the 10-year U.S. Treasury. A slightly more nuanced (some might say opaque) way is to measure the extra yield further out on the yield curve after short-term rates correct to “normal,” though the determination of normal and the rate of correction give rise to a number of competing models. That measure is called term premium and has averaged 1.65%. In practice, the slope of the yield curve and the extra payment for term once the short-term rate has normalized are satisfyingly similar since 1990 at 1.1% and 1.2%, respectively.
Here again, shifting regimes reveal more complex interworkings than simply noise around a long-term mean. Until 1990, term premiums were generally quite high—and even higher than the yield curve slope, as short-term rates were elevated and expected to come down, although they didn’t for years. Post-2008, the opposite was true, as zero-interest-rate policy (ZIRP) failed for years to ignite growth. This was compounded by government buying of bonds that artificially depressed term premiums and an entrenched regime of negative stock and bond correlation that promoted demand for term risk regardless of unattractive yield levels.
Understanding the term premium as payment for the uncertainty around future inflation and rate levels, we currently have two competing forces. First, the regime of higher growth and inflation and massive deficits in a time of growth is an unusual one, especially coming off the heels of a supply-driven inflationary episode. So uncertainty around future inflationary levels is high, providing an argument for higher term premiums. Countering that force is the credibility and transparency of the Fed. Despite acting too slowly to counter inflation in 2021 and 2022, the Fed has since regained stability in pricing. The long-term inflation swaps and Treasury inflation-protection securities (TIPS) breakeven levels in the low 2% range confirm that long-term inflation expectations have yet to become unmoored, arguing for a continuation of low and declining term premiums experienced over the last 30 years.
As shown in Figure 5, the period from 1990 to today averaged 110 bps of 10-year term premium, though excluding the depressed term premiums from “Operation Twist” in 2011 onward would yield a higher average of 185 bps term premium. We accept that the credibility of the Fed should warrant a lower term premium and cannot rule out a return to negative correlation between stocks and bonds, which would also serve to lower the compensation necessary for holding duration. Thus, we think a lower range, bounded at the high end by the longer-term average, is an appropriate estimate of term premium over the next several years.
Figure 5. Countering Forces and Fed Credibility Suggest Low Term Premium
Term premium, January 1, 1971-December 31, 2024
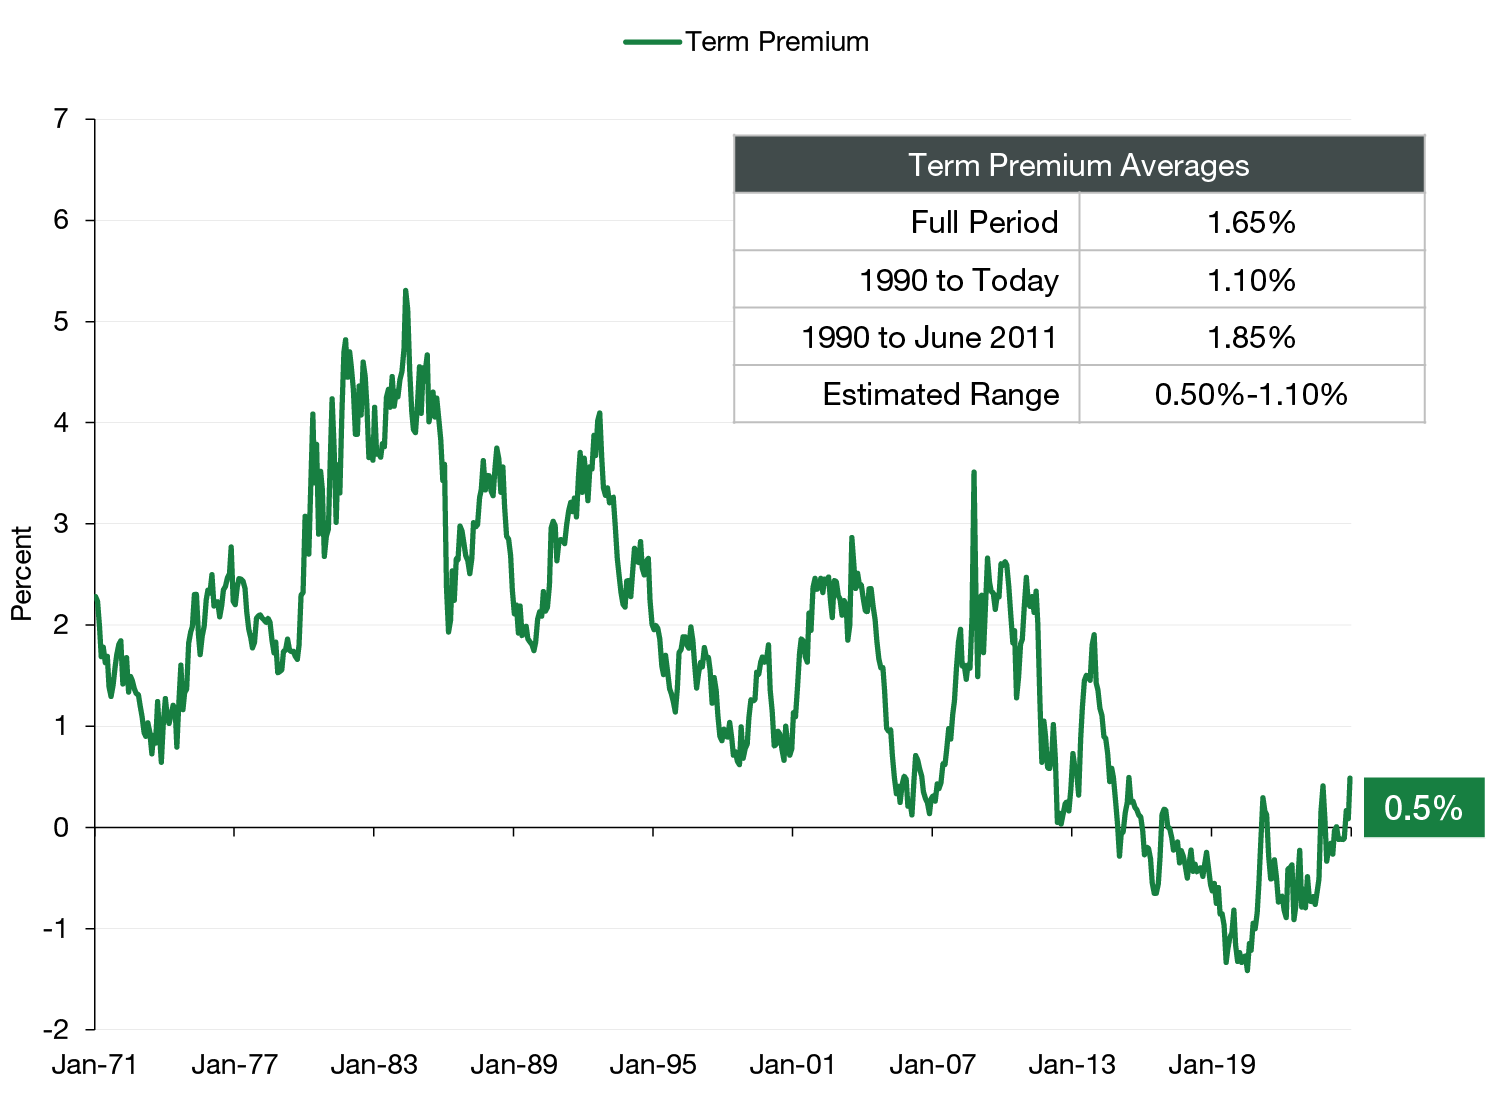
Source: Bloomberg. Data as of December 31, 2024. Term premium shown using the ACMTP10 model, developed by New York Fed economists Tobias Adrian, Richard Crump, and Emanuel Moench, which represents the extra compensation investors require for holding longer-term Treasury securities instead of rolling over shorter-term ones. This premium accounts for the risk that interest rates may change over the bond's life. For illustrative purposes only and does not represent any specific portfolio managed by Lord Abbett or any particular investment. Indexes are unmanaged, do not reflect the deduction of fees or expenses, and are not available for direct investment.
Adding Up the Components
We find today’s interest rate levels well justified by the component analysis above, with the midpoint levels of our ranges very close to current levels. Conditions can change, of course, and we will adjust our views accordingly with new data, but currently there are no glaring biases in fixed income pricing.
Figure 6. Short- and Long-Term Rates Appear Reasonable
The building blocks of the fed funds terminal rate and the 10-year U.S. Treasury bond yield
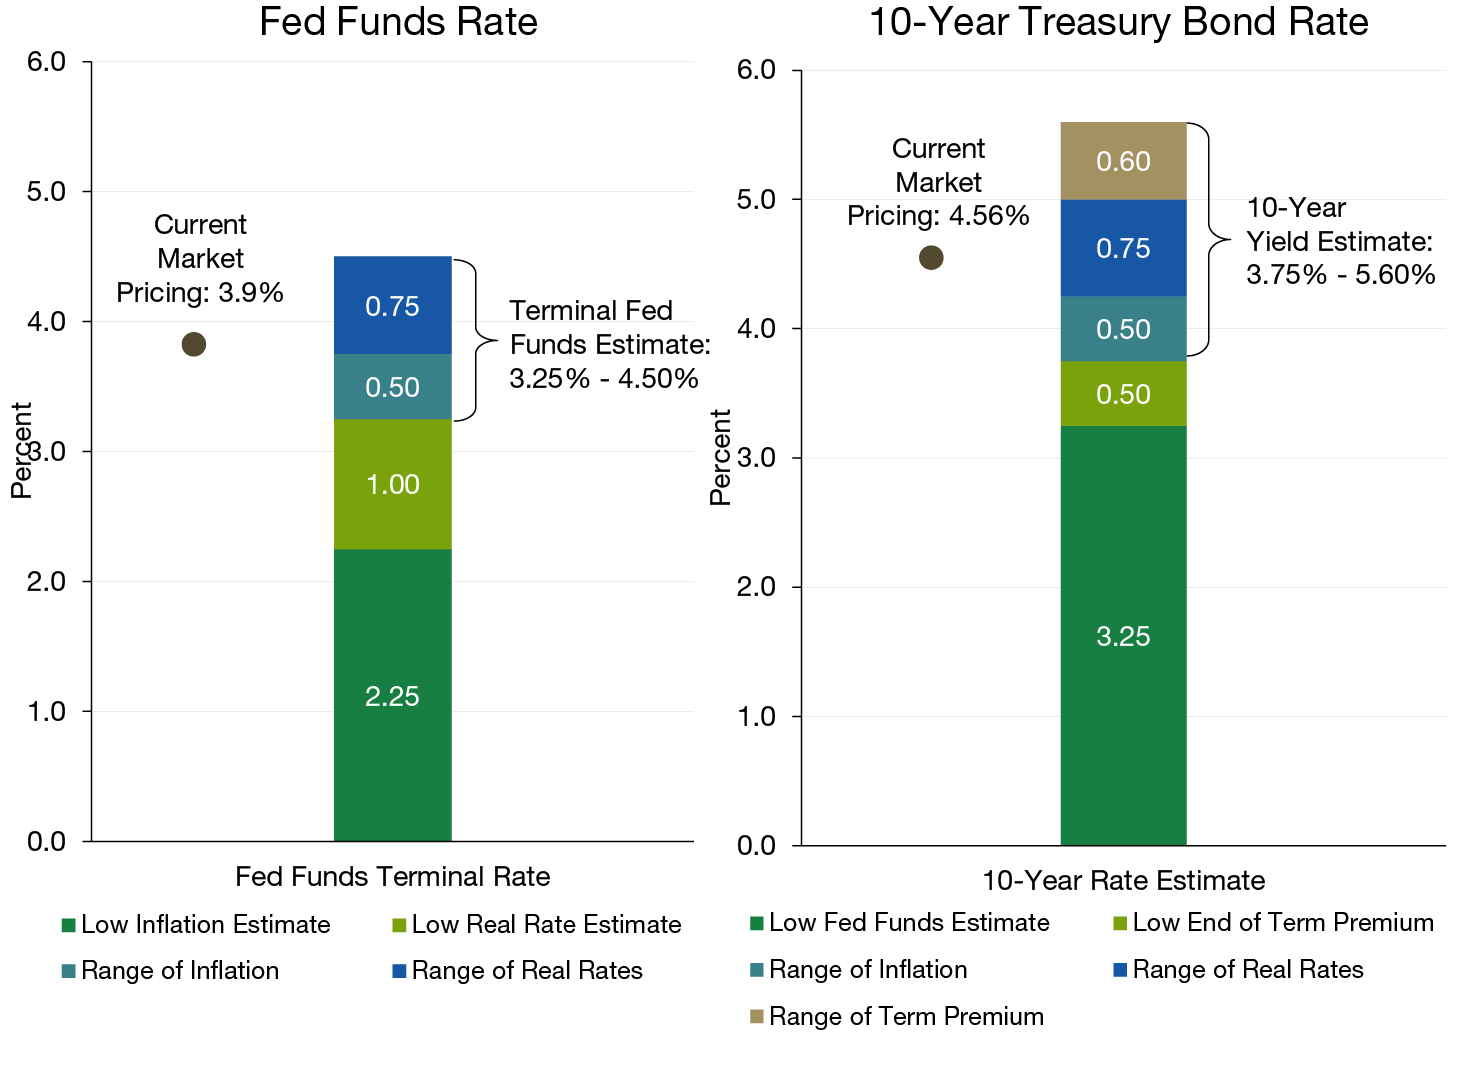
Source: Bloomberg and Lord Abbett. Data as of December 31, 2024. For illustrative purposes only and does not represent any specific portfolio managed by Lord Abbett or any particular investment. Indexes are unmanaged, do not reflect the deduction of fees or expenses, and are not available for direct investment.
Implications for Fixed Income Investing
The uncertainty around interest rates is understandable as the “neutral” or long-run state of the components is unobservable, and no economic environment is the same. We believe active rate positions should be modest in most periods, but especially today as current pricing of short-term and long-term rates is reasonable given the history of the components and the current economic backdrop. However, we believe fixed income is an attractive option in this environment. We have good reason to trust the Fed will, over the long run, achieve its dual mandate of price stability and full employment simply because we have experienced a wide array of shocks over the last 30 years that have been successfully managed by the Fed. As such, current yields provide excellent compensation for the risks that this time is very different from those periods. If the Fed’s 3% estimate of terminal rate were to be achieved, for example, that would provide a healthy tailwind for fixed income allocations over the next several years.
Finally, credit exposures along the curve can enhance yields while offering a diversifying risk to the underlying rate risk in fixed income. Figure 7 shows examples of how long-term and short-term investment-grade corporate credit can potentially provide an attractive yield and sound breakeven characteristics.
Figure 7. Credit Can Offer Diversification from Rate Risk
Estimated one-year holding period returns of sample bonds under different rate scenarios as of December 31, 2024
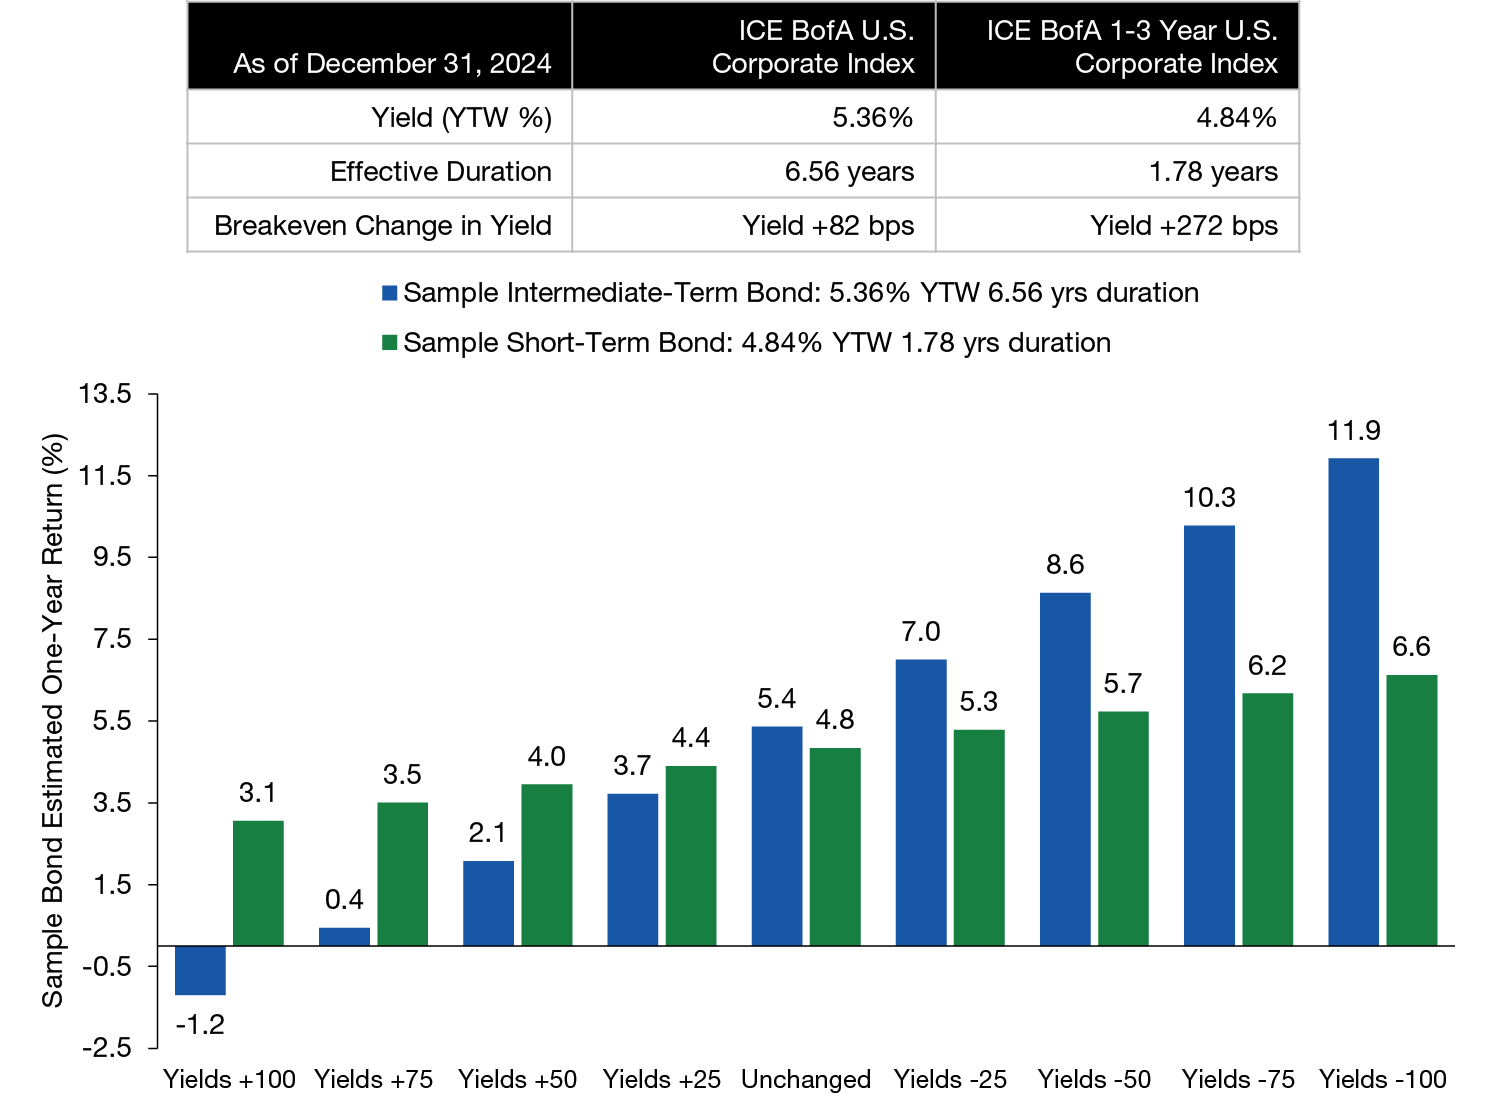
Source: Lord Abbett. Data as of December 31, 2024. Estimated returns are based on a sample bond with the yield and duration of the ICE BofA U.S. Corporate Index and the ICE BofA 1-3 Year U.S. Corporate Index. One-year holding period estimated return assumes starting yield is earned in income over the course of the year. The price impact is (change in yield) * (effective duration). Sample bond one-year holding period estimated returns are gross of any fees and are for example only.
This is for illustrative purposes only and to provide a framework to understand the potential impact from various interest rate environments. The sample bond one-year holding period performance does not represent actual performance, was not achieved by any investor, and actual results may vary substantially. No investor achieved these returns. Indexes are unmanaged, do not reflect the deduction of fees or expenses, and are not available for direct investment. The estimated returns based on simple bond mathematical calculations are not intended to be a guarantee or a predictor of future results.