Key Points

  • Global financial markets have surged with easier financial conditions and broad-based earnings growth, with optimism about the adoption of artificial intelligence (AI) a dominant theme.
  • The resilience of China and other major overseas economies has been critical for sustaining global growth, and inflation has continued decelerating in most countries.
  • Risks to watch include investor responses to rising U.S. debt levels, geopolitical conditions, and developments that could potentially derail expectations for the continued growth of AI.

Central Bank Policies Influence Global Financial Markets

As 2026 begins, financial conditions have eased around the world, led by central banks lowering interest rates in virtually every country. That has triggered, along with other factors, strong stock markets globally, tightened credit spreads, and ample availability of credit.

Figure 1. Global Financial Conditions Have Eased

U.S. Financial Conditions Index (top) and Global Financial Stress Index (bottom), November 10, 2024–November 10, 2025

Line Chart Showing U.S. Financial Conditions Index, November 10, 2024–November 10, 2025
Line Chart Showing Global Financial Stress Index, November 10, 2024–November 10, 2025
Source: Bloomberg, Goldman Sachs, and BofA Merrill Lynch. Data as of November 10, 2025. For illustrative purposes only and does not represent any specific portfolio managed by Lord Abbett or any particular investment.

One encouraging sign for investors has been that central banks have not been overly rigid about hitting their inflation targets in the very short run. For example, while the U.S. Federal Reserve’s (Fed) inflation target is 2%, inflation has held above that level. Nevertheless, the Fed has decided that inflation is heading lower in the medium term and close enough to its target to allow it to implement rate cuts aimed at supporting real economic activity and maximum employment, even as inflation remains slightly above target. Financial markets have taken a positive view of this policy flexibility, and medium-term inflation expectations have remained well-anchored, consistent with the 2% target.

Broad Earnings Growth and AI Hopes Fuel Multiple Expansion

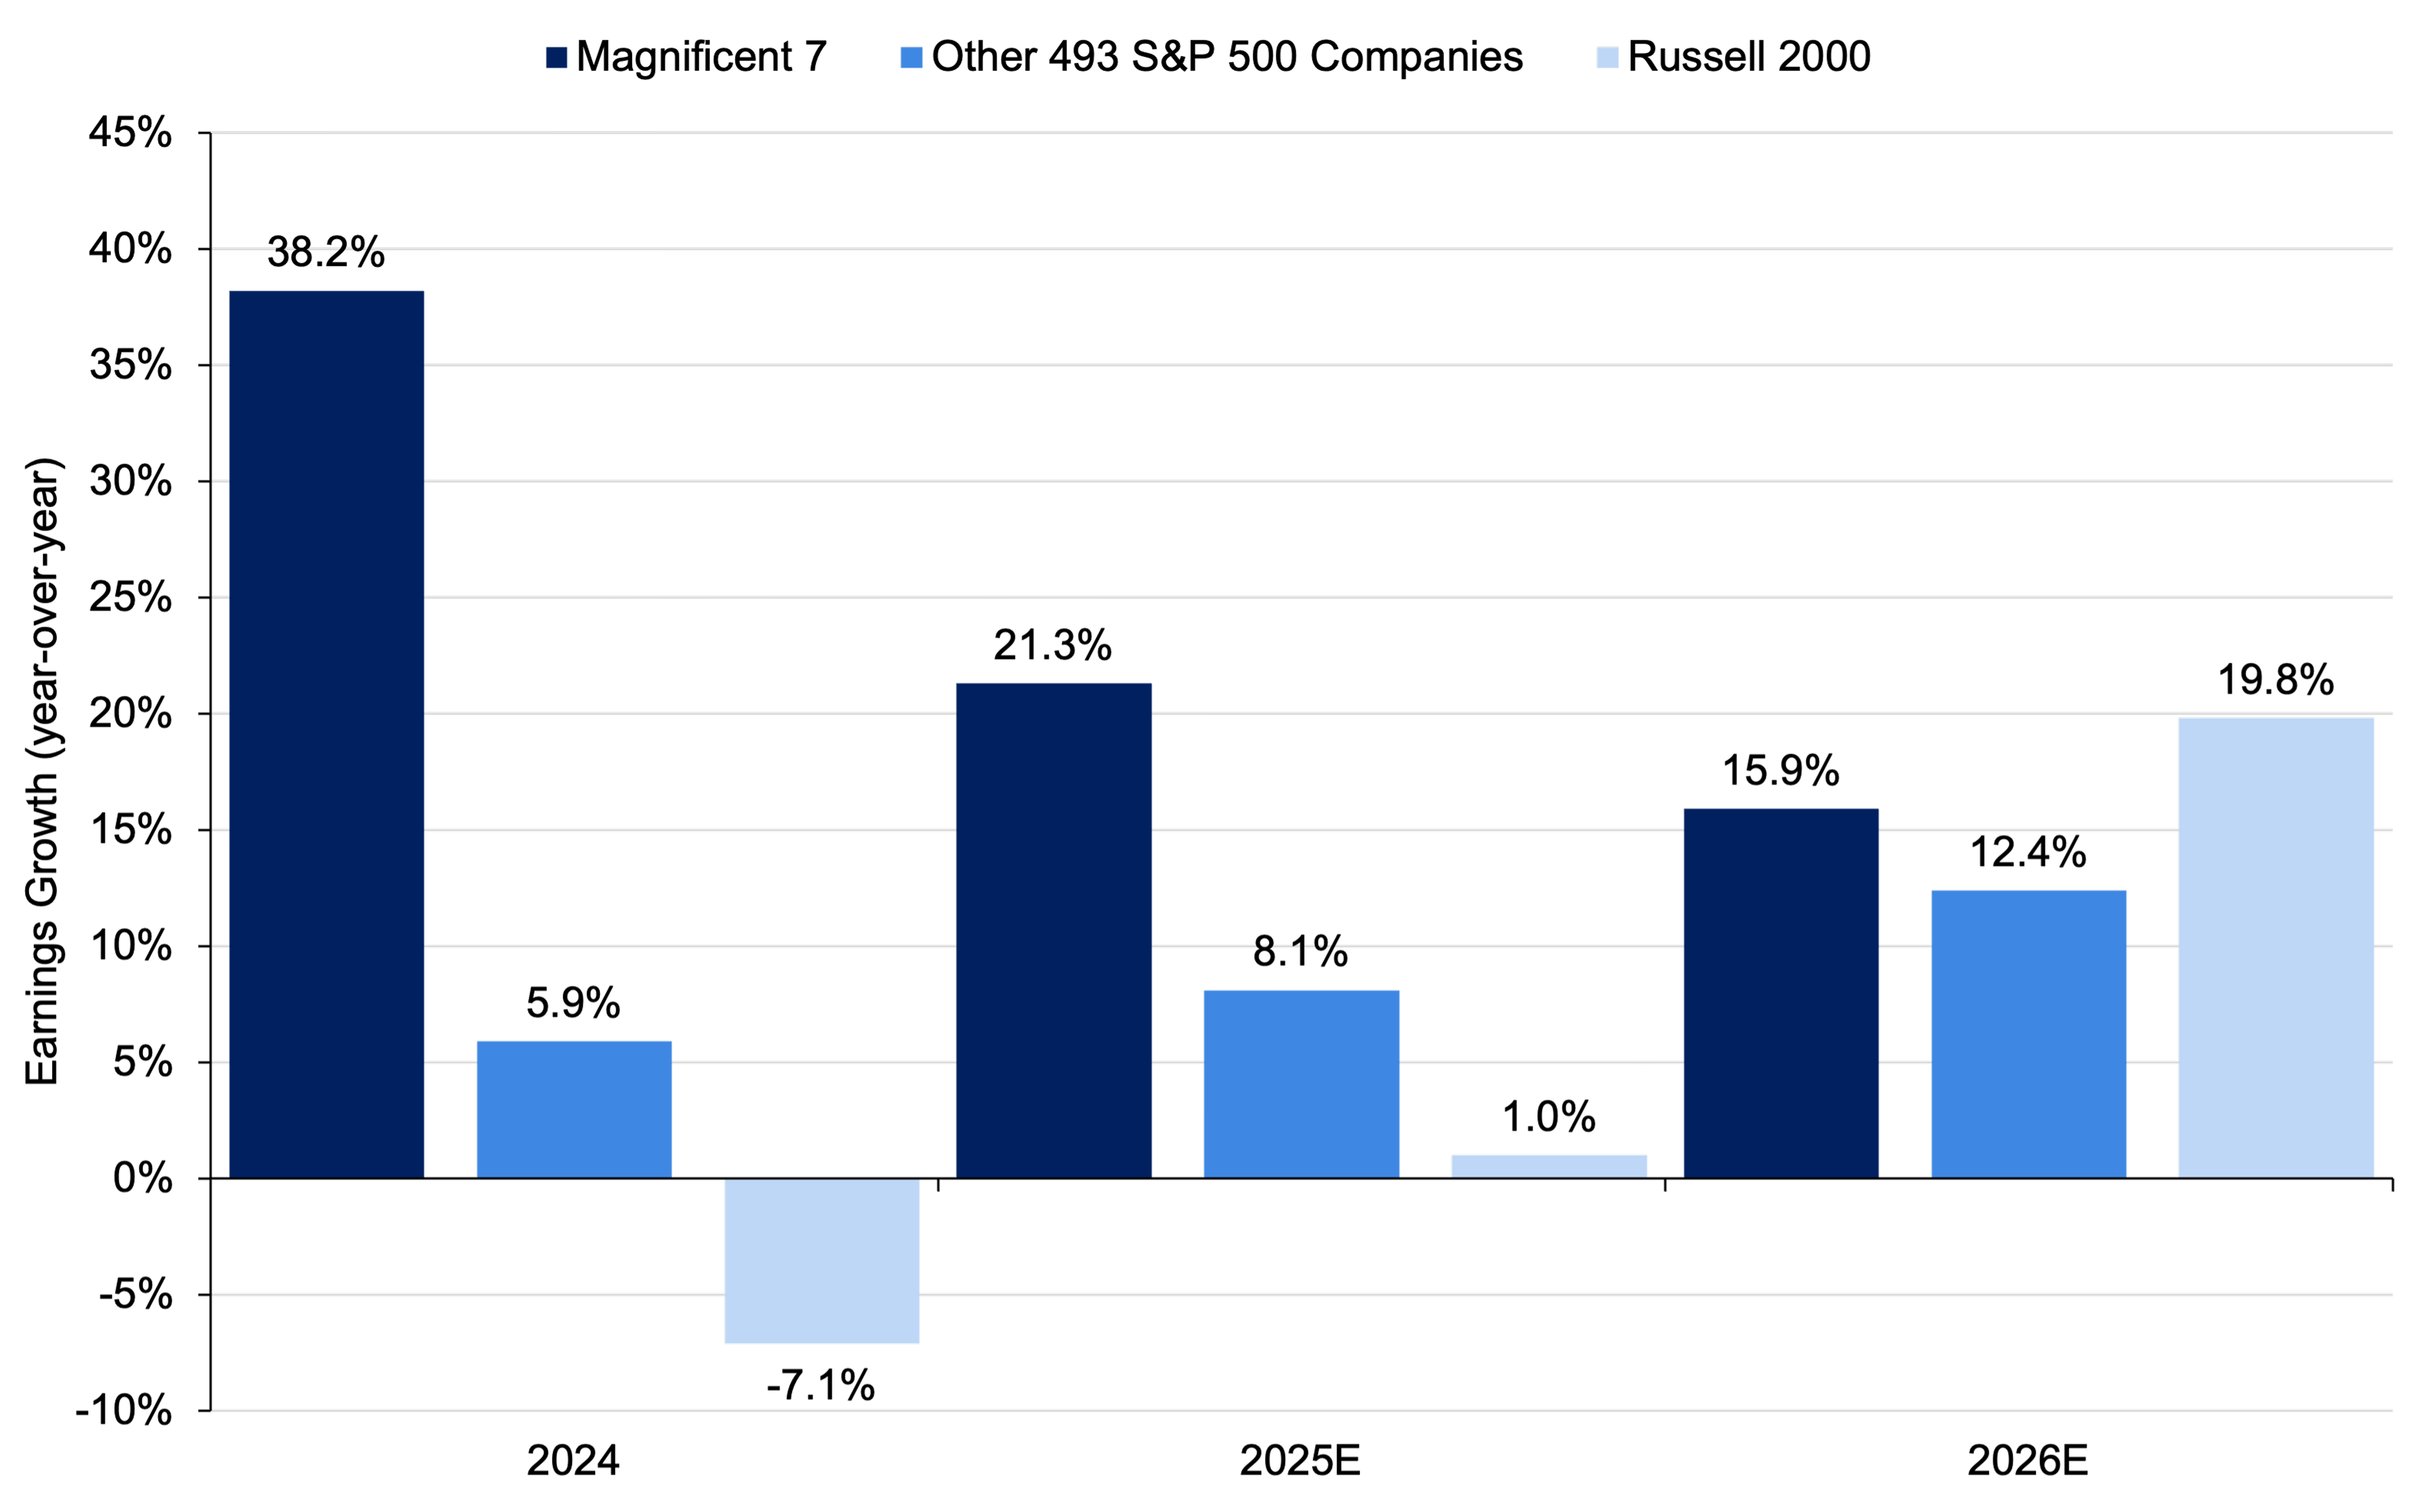
Strong earnings growth, led by the technology sector (but not just concentrated in tech), has also supported financial markets. The broadening of earnings growth beyond tech has also been met with expanding multiples, driven mostly by the outlook for AI. Although it remains uncertain how far AI developments will transform businesses, there is still plenty of room for optimism. AI shows promise not just in making scientific research and drug discovery processes more effective, but also as a developing general-purpose technology that can be applied across businesses and industries to boost efficiency. The expansion of equity valuation multiples has been, in part, an expression of that optimism.

Key Themes Extend to Overseas Markets

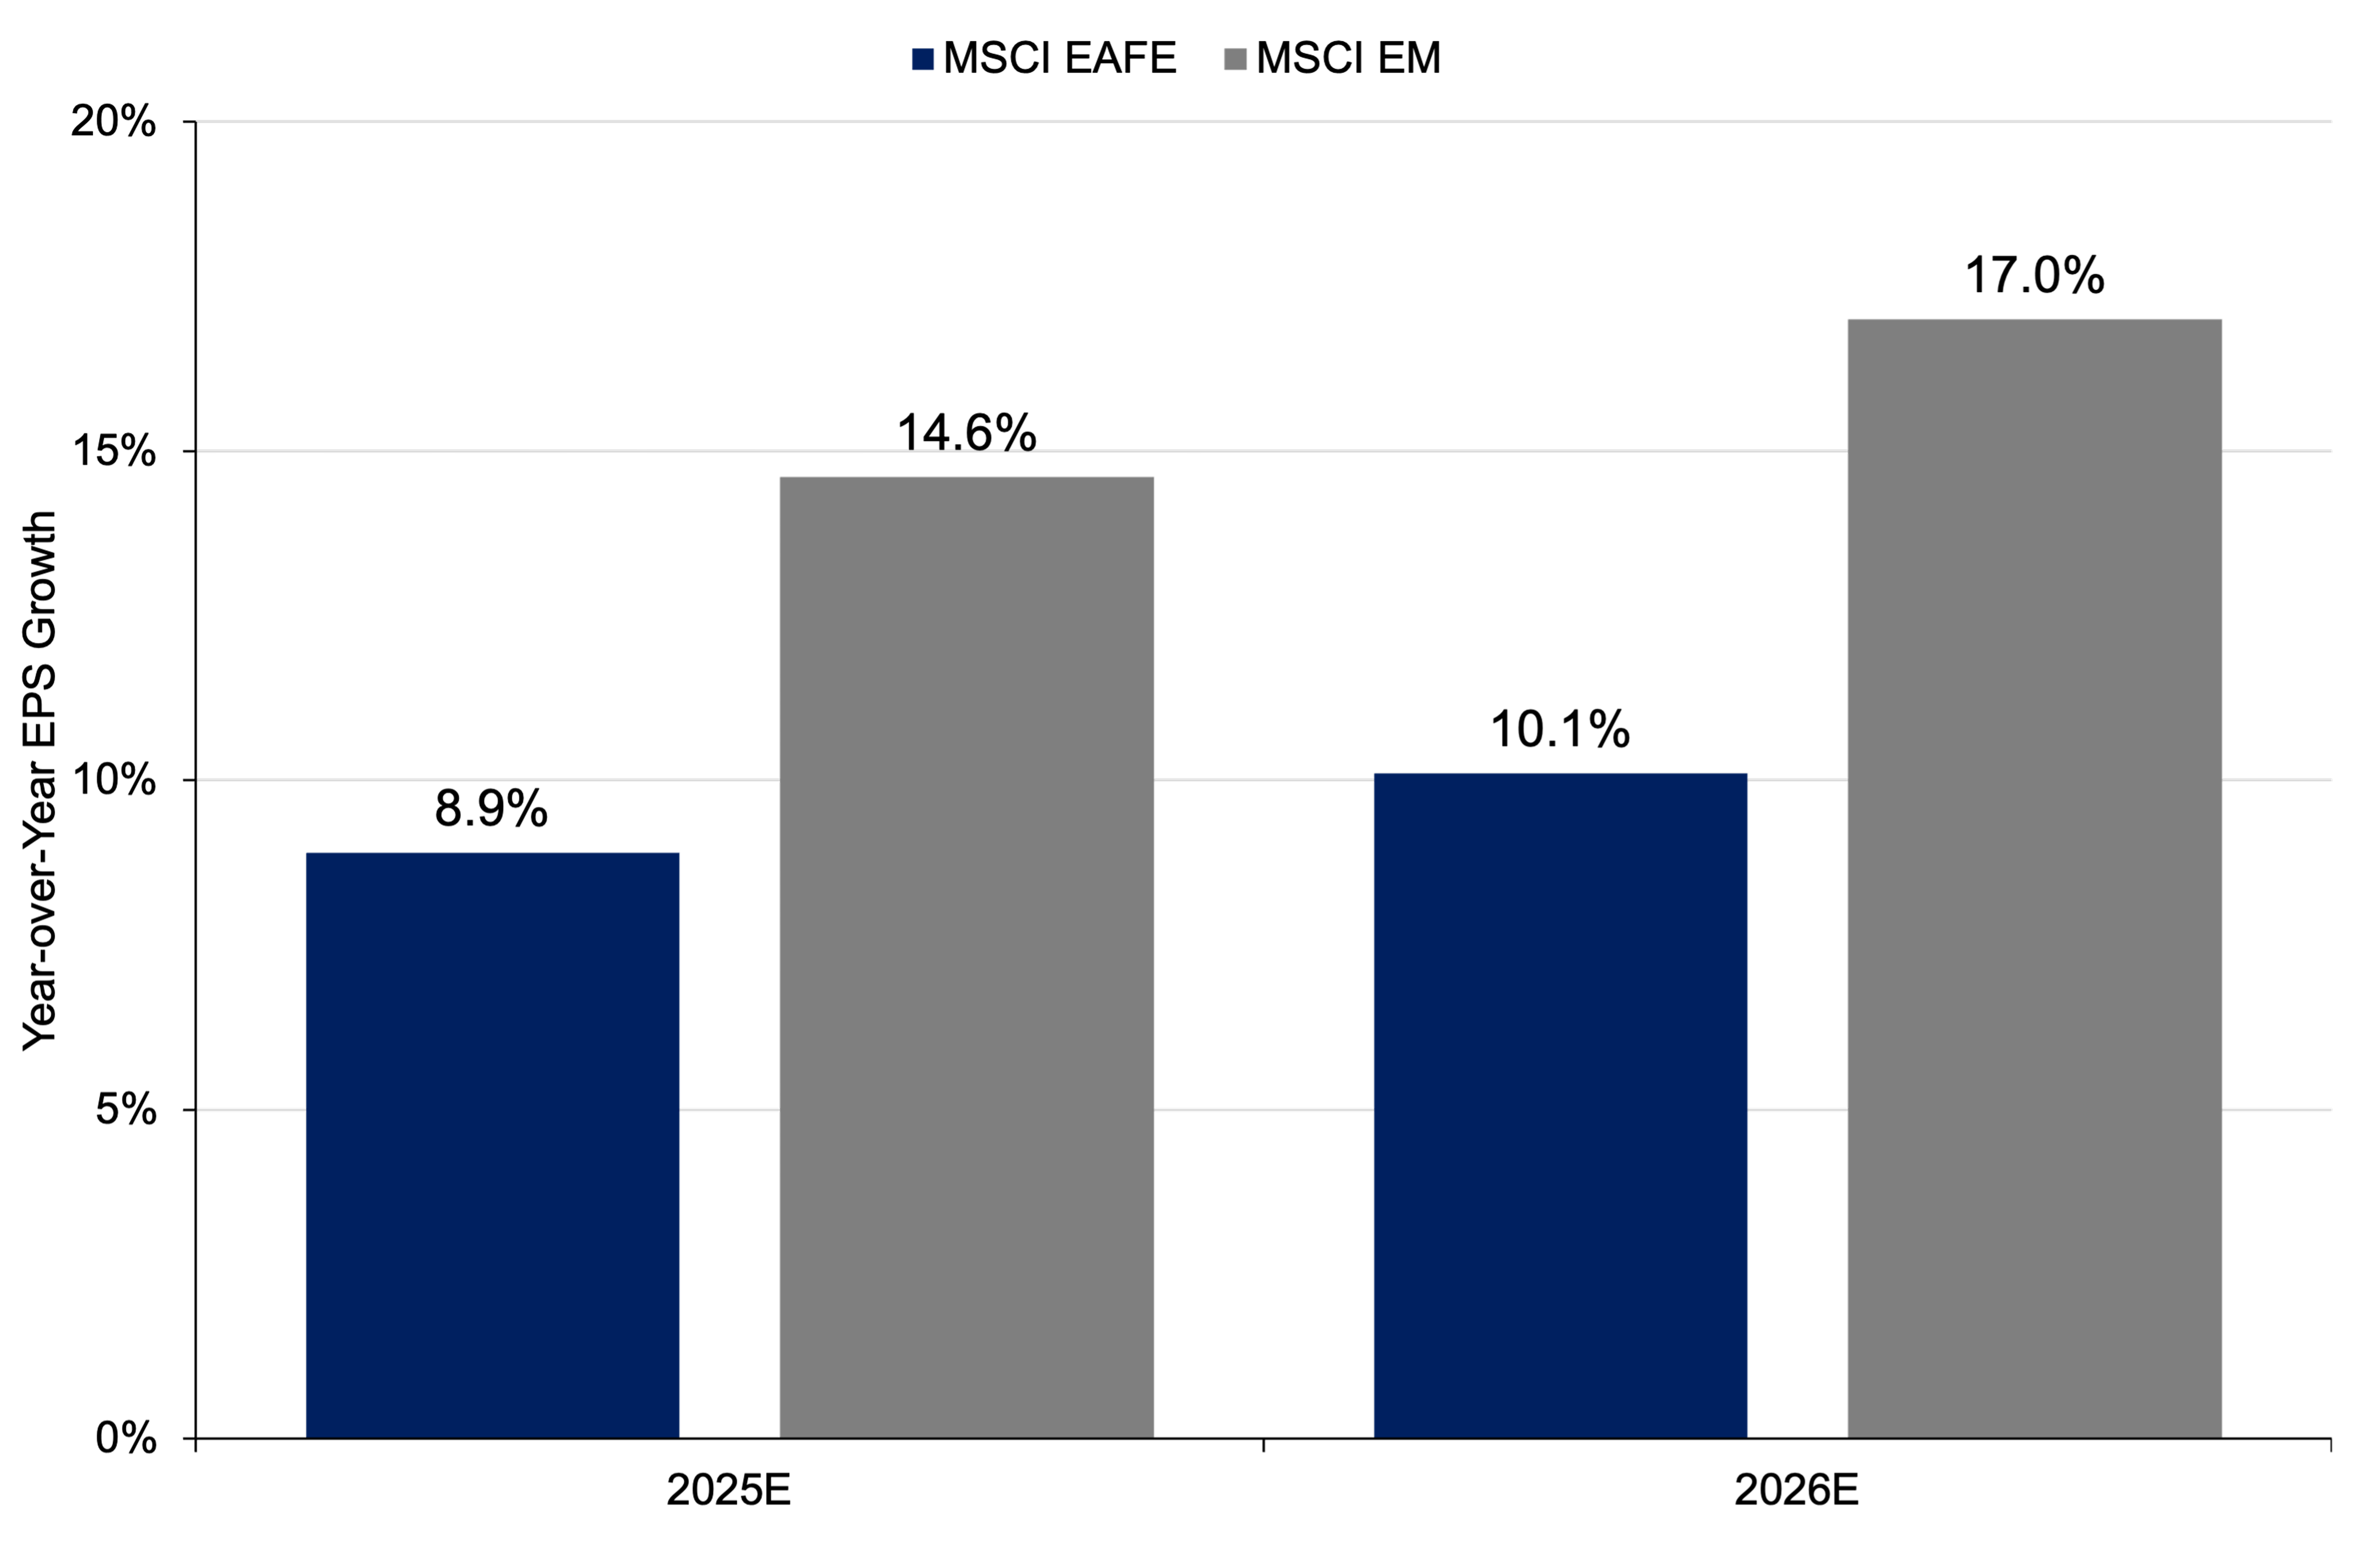
Multiple expansion, driven by lower interest rates, the promise of AI, and relatively low inflation, has also been a strong tailwind for financial markets globally. This strength is evident not only in the United States, where stocks have risen about 17% this year through October 31—based on the performance of the S&P 500® Index—but also internationally. The MSCI All Country World Index (ACWI) ex-U.S. has risen about 28% in the same period, reflecting both a weaker U.S. dollar and robust performance by overseas companies. This marks a notable shift from prior years, when non-U.S. equities, despite appearing attractively valued, consistently underperformed U.S. stocks. In contrast, many international markets, including Japan, the Eurozone, the United Kingdom, and several emerging economies, have posted higher returns in 2025.

Global Growth Prospects Driven by Major Economies

Another major theme has been resilience in China. China’s transition from a housing-led economy to an export-driven model has faced challenges. The risks to its export sector came in the form of tariff policy in the United States, as well as growing unease in industries globally where China has expanded rapidly, particularly in motor vehicles, especially electric vehicles (EVs). Despite these headwinds, industrial activity in China has been resilient, boosting high value-added production at home and leveraging its trade relationships with countries such as Vietnam and Thailand to maintain overseas market access. What happens domestically in the United States and China has a significant impact on the global economy due to their size. China’s continued strong performance and its avoidance of political and financial crises have underscored its resilience, which has been a major factor shaping the global economy.

Europe has seen stronger growth amid challenges posed by the ongoing war in Ukraine, high energy costs, and uncertainty about future supply, and rising military spending. Indeed, spending on redevelopment and expansion of member nations’ defense and security infrastructure, and a relaxation of budgetary rules in major economies in the region, have acted as fiscal stimulus, lifting Eurozone growth above the sluggish 1% previously seen. Meanwhile, Japan has maintained pro-growth policies that the new government appears to be committed to.

A Supportive Era for Cryptocurrency, Stablecoins, and Tokenization

The United States has taken a strong stance in supporting the development of cryptocurrency, stablecoins, and tokenization, an approach that contrasts with the caution of the previous administration and global central banks. This backing has fueled momentum in the industry, driving rallies in digital currencies and shares of related businesses and accelerating the adoption of new payment systems. While these innovations carry both risks and benefits, they now appear poised to potentially become a permanent part of the financial landscape. Given that global payment systems underpin the entire financial system, any shift, whether disruptive or enhancing, could have far-reaching implications.

Risks to Watch in 2026

Growing Deficits

An unresolved challenge for global markets is the rapid growth of public-sector debt in relation to economic output, particularly in the United States. U.S. debt appears to be on a path to rise indefinitely as a share of GDP, soon crossing the 100% threshold. While the exact number matters less than the prospect of its continued rise, investors may eventually demand more compensation for bearing this risk.

Inflation and Tariffs

An unresolved issue remains around the inflationary impact of U.S. tariffs. If tariffs raise the baseline level of inflation, it could complicate the Fed’s ability to cut rates before reaching its target, highlighting ongoing tension between fiscal and monetary policy. Markets are currently priced for the Fed to lower rates another 100 basis points in 2026, and stubborn inflation could force a re-assessment.

The Ukraine War

Another significant risk stems from the ongoing conflict in Ukraine, which has continued to escalate rather than diminish. The longer the conflict drags on, the more pressing the threat to global food supplies and the more pressing the necessity of substituting low-priced Russian oil and natural gas with more expensive alternatives.  

Key Points

  • Despite tariff concerns and a late-year government shutdown, gross domestic product (GDP) growth stayed positive; inflation has moderated toward 2.8%; and corporate earnings have been strong.
  • The Federal Reserve (Fed) resumed rate cuts and fiscal measures are set to provide incremental stimulus in early 2026, creating a more accommodative backdrop for risk assets.
  • Although credit spreads remain tight, healthy corporate fundamentals and strong investor demand for yield support opportunities across fixed income markets.

As 2025 draws to a close, the U.S. economy has proven remarkably resilient in the face of significant challenges. Earlier in the year, fears of tariff-driven disruption dominated headlines, and a prolonged government shutdown in the fourth quarter added uncertainty. Yet, real GDP growth remained positive, supported by corporate adaptability and prudent policy adjustments. Inflation has moderated toward 2.8%, still above the Fed’s target but trending lower, and growth, while slower than mid-year highs, has held steady enough to avoid recession. This resilience sets the stage for a constructive investment environment as we look ahead to 2026.

A Positive Backdrop for Fixed Income: Rates, Resilience, and Opportunity

Monetary policy has shifted meaningfully. After a nine-month pause, the Fed resumed rate cuts in September and October, reducing rates by 50 basis points (bps) in total. These moves follow earlier cuts totaling 100 bps in late 2024. The rationale has been slower hiring, low turnover, and revisions to prior payroll data that showed negative prints. With a new Fed chair expected in May 2026, we believe the policy bias appears firmly toward easing, reinforcing a more accommodative backdrop for risk assets.

Consumer dynamics tell a more nuanced story. Spending remains solid overall, but the economy is increasingly K-shaped. Higher-income households continue to drive consumption, buoyed by strong asset prices, due in part to rising home prices, near-record household wealth, and equity gains. In contrast, lower-income cohorts face pressure from elevated price levels and tighter credit conditions, reflected in rising subprime auto delinquencies and trade-down behavior. The middle-income segment will be critical in determining whether these headwinds spill over more broadly. For now, consumer activity in aggregate remains healthy, but pockets of weakness warrant close monitoring.

Labor markets have also softened but have not collapsed. Job creation has slowed, and turnover is low, signaling a deceleration without widespread layoffs. Yet, immigration policy changes have contributed to reduced labor supply, and while unemployment has ticked up to 4.3%, it remains historically low. This evolving backdrop points to why the Fed has resumed cutting rates, and why further easing may be necessary if labor market conditions weaken further.

Inflation has been trending lower as we move through the fourth quarter of this year. And while recent data have been limited, inflation swaps have been indicating levels around 2.5% (see Figure 2). This suggests a quarter characterized by slowing growth and slightly lower inflation, though still above the Fed’s target. Meanwhile, fiscal policy has been neutral to slightly stimulative. Legislation passed earlier in 2025 provides modest support, and provisions are structured to deliver incremental stimulus in the first quarter of 2026. This combination of monetary policy easing and the potential for positive effects from fiscal activity supports a positive outlook for growth.

Figure 2. Inflation Swaps Have Shown Moderating Inflation Expectations

U.S. dollar inflation swap rate, November 21, 2024–November 21, 2025

Line Chart Showing U.S. dollar inflation swap rate, November 21, 2024–November 21, 2025
Source: Bloomberg. Data as of November 21, 2025. The USD zero-coupon inflation swap is a derivative used to transfer risk from one party to another through an exchange of cash flows. In a zero-coupon inflation swap, only one payment is made at maturity, where one party pays a fixed rate on a notional fixed amount, while the other party pays a floating rate linked to an inflation index. For illustrative purposes only and does not represent any specific portfolio managed by Lord Abbett or any particular investment.

Valuations and Issuance Trends in Credit Markets

Against this backdrop, credit markets present a compelling picture. Credit spreads remain tight by historical standards across investment-grade corporate bonds, high yield bonds, and securitized securities. While spreads have widened slightly from recent lows, they reflect strong fundamentals. Corporate earnings have been solid, with mid-to-high single-digit revenue growth and double-digit net income gains. Balance sheets remain healthy, and real estate markets, both commercial and residential, appear to be stabilizing as Treasury yields and mortgage rates moderate, which can help to improve affordability and reduce refinancing pressure.

Figure 3. Tight Credit Spreads a Reflection of Strong Fundamentals

Chart with Credit Spreads
Source: Bloomberg and ICE Data Services, LLC. Data as of November 21, 2025. The option-adjusted spread (OAS) is the yield spread that must be added to a benchmark risk-free yield curve (usually U.S. Treasuries) to discount a bond’s cash flows so that its present value equals its market price, after adjusting for the impact of embedded options. It measures the difference between a bond’s yield and the risk-free rate. High yield=ICE BofA U.S. High Yield Index. IG Corporate=ICE BofA U.S. Corporate Index. CMBS=ICE BofA CMBS Index. ABS=ICE BofA Fixed-Rate Asset Backed Securities Index. MBS=ICE BofA U.S. Mortgage Index. For illustrative purposes only and does not represent any specific portfolio managed by Lord Abbett or any particular investment.

Supply-and-demand dynamics have been constructive, with high yield issuance trending only modestly higher and remaining relatively contained on the supply side, driven largely by refinancing activity. At the same time, strong investor demand for yield persists, with potential upside if mergers and acquisitions (M&A) activity accelerates. Investment-grade supply has been driven by corporate spending on infrastructure for artificial intelligence (AI) and other strategic initiatives. On the demand side, appetite for yield remains strong, supported by solid returns and an attractive income environment. Technicals in high-quality fixed income appear balanced, with healthy supply absorbed by robust institutional and retail demand.

In private credit, headlines have focused on isolated stress, particularly in 2021–2022 vintages marked by aggressive lending during zero-interest-rate conditions. These issues are real but not systemic, in our view. The Fed’s rate cuts can ease debt service burdens for floating-rate structures, which can help to mitigate risk for issuers. Although defaults may rise modestly, high yield and broadly syndicated loans (BSLs) should generally remain resilient, supported by strong credit fundamentals.

One emerging theme that could impact issuance and sector dynamics is the massive buildout of AI infrastructure. Hyperscalers are investing hundreds of billions of dollars annually in data centers, power generation, and related technology. While these projects create opportunities across investment-grade, high yield, leveraged loans, and securitized markets, they also carry risks. History shows that large-scale infrastructure cycles, such as in the telecommunication industry in the 1990s—and the shale revolution in the oil and gas industry—can end in oversupply. For now, the buildout is in the early stages, but vigilance is essential. Active managers must be selective, favoring issuers with strong fundamentals as issuance accelerates. At the same time, large, highly rated technology companies issuing multi-tranche debt at attractive concessions present attractive opportunities for investors seeking quality and yield.

The Road Ahead: Questions, Challenges, and Active Opportunities

Looking ahead, several key questions may define the investment landscape: Will AI-driven capital spending prove sustainable or evolve into a bubble? Will the tension between solid GDP growth and a softer labor market resolve toward strength or weakness? How significant will credit cracks become, and will they remain idiosyncratic rather than systemic? Will inflation continue to moderate, or surprise to the upside, complicating the Fed’s easing path? And how will immigration trends, now sharply reversed, affect labor supply, wages, and growth potential? These uncertainties underscore the need for flexibility and rigorous risk management.

Despite these potential challenges, the outlook for 2026 remains constructive. Easing monetary policy, fiscal support, and resilient corporate fundamentals could create a favorable backdrop for credit-sensitive sectors. In this environment, active management and multi-sector strategies may be critical. Sector performance may vary widely with macroeconomic conditions, and dynamic allocation across credit markets offers the opportunity to capture value while mitigating risk.

Key Points

  • Despite strong performance, historical context shows the current bull market remains average compared to past cycles, suggesting valuations are far from bubble territory.
  • Hyperscalers are on track to fuel rapid revenue growth across technology and infrastructure sectors. Unlike traditional projects, artificial intelligence (AI)-related investments are generating revenue growth quickly, creating a potential earnings tailwind.
  • While consumer sentiment has reflected concern, stable employment and fiscal measures could support spending in 2026. Mergers & acquisitions (M&A) and initial public offering (IPO) activity could also signal renewed confidence and healthier market breadth.

At mid-year, optimism was building as second-quarter earnings rolled in. Roughly 70% of companies had exceeded estimates, according to FactSet, and many were guiding higher for the remainder of the year. Fast forward to today, the S&P 500® has delivered double-digit returns, year-to-date through the end of November 2025. Yet, despite strong performance, questions persist, most notably around whether current valuations signal a bubble.

Are We in a Bubble?

The recent rise in equities has been driven primarily by earnings growth. Third-quarter results mirrored the strength of the second quarter, with broad-based gains pushing S&P 500 earnings growth to approximately 15%.

And importantly, context matters. While the current bull market has doubled off its October 2022 lows—a strong absolute performance—it remains average by historical standards. Over the past century, bull markets typically last three years and deliver about 100% gains.1 By comparison, the 1980s Reaganomics bull market lasted over five years and delivered exceptionally strong returns. The dot-com era extended beyond five years with even greater gains, and the post-global financial crisis (GFC) bull market ran for six years, also producing robust performance. To match those historical periods, today’s market would need to push the S&P toward 12,000 by 2028–2029 to resemble those periods. While that’s not a forecast, it underscores that current conditions are far from bubble territory, compared to history.

The Ecosystem Behind Artificial Intelligence (AI) and the Capital Spending Surge

One of the most powerful themes driving markets higher is the expansion of AI and the massive capital expenditure (CapEx) behind it. Hyperscalers, such as Google, Amazon, Microsoft, Meta, and Oracle, were initially expected to spend $250 billion on CapEx this year.2 That estimate proved far too conservative. Actual spending is on track to hit $400 billion, a $150 billion increase (see Figure 4). This surge usually flows directly into earnings for companies building the infrastructure—semiconductor manufacturers, heating, ventilation, and air conditioning (HVAC) providers, and electrical contractors for data centers. That additional CapEx often flows directly into earnings growth for the companies building and equipping data centers.

Figure 4. AI Hyperscaler CapEx Has Continued to Grow Meaningfully

Total CapEx - Alphabet, Amazon Web Services, Meta Platforms, Microsoft, Oracle

Bar Chart showing Total CapEx - Alphabet, Amazon Web Services, Meta Platforms, Microsoft, Oracle
Source: Goldman Sachs. Data as of November 30, 2025. Past performance is not a reliable indicator or guarantee of future results. Data for 2025, 2026, and 2027 reflect consensus estimates. There is no guarantee any forecast, estimate, or projection will be realized. CapEx shown is company total, except for Amazon, which reflects an estimate for Amazon spend. Hyperscalers are the large cloud computing companies that own and operate data centers with horizontally linked servers that, along with cooling and data storage capabilities, enable them to house and operate AI workloads.

Unlike traditional projects that take years to pay off, hyperscalers’ AI-related investments are generating revenue growth more quickly. Demand for computing power, driven by tools like ChatGPT, Copilot, and partnerships with firms such as Anthropic, has continued to exceed supply, and as user requests grow more complex, data center spending has accelerated, fueling revenue growth for hyperscalers and their ecosystems.

Beyond technology, across sectors from consumer to financials, companies leveraging generative AI have been able to boost productivity and efficiency. The result has been a broad-based return on unprecedented levels of capital investment.

Consumer Dynamics: A K-Shaped Economy

While corporate earnings and AI-driven growth dominate headlines, the consumer remains the driver for roughly 70% of U.S. gross domestic product (GDP), according to the U.S. Bureau of Economic Analysis. Recent surveys reflect mixed sentiment, and the economy increasingly resembles a K-shaped recovery. That means high-end consumers continue to spend, supporting sectors like luxury travel and premium brands. Low-end consumers, however, face significant challenges, pressuring companies that cater exclusively to this segment. Consumer-related equities have lagged this year, with both staples and discretionary stocks underperforming broader indexes. Yet, there are reasons for cautious optimism heading into next year.

The labor market remains stable, and while job growth is not explosive, it provides a solid foundation for consumer spending. Policy tailwinds, including monetary easing and fiscal measures such as tax relief on tips under the One Big Beautiful Bill Act (OBBA) passed earlier in 2025, are expected to help boost disposable income. Additionally, the lagged effects of prior rate cuts and targeted stimulus programs should begin to flow through the economy in early 2026, further supporting consumer confidence and demand.

Selectivity will be critical. Company performance increasingly depends on positioning within the consumer sector and the ability to adapt to shifting demand patterns. For investors, this creates opportunities in well-managed brands and sectors poised to benefit from cyclical recovery.

Signs of Growing M&A and IPO Activity

After years of muted deal-making, M&A and IPO activity is showing renewed strength. M&A volumes are up 40%, year-to-date, while IPO activity is on track to rise more than 60% (see Figure 5). In fact, per Renaissance Capital, there were 64 U.S. IPOs raising a combined $15.3 billion in 3Q25—the best quarter since 2021. While these figures benefit from easy comparisons to a weak 2024, the trend suggests deal flow has accelerated.

Figure 5. IPO Activity Has Recently Begun to Pick Up Again

U.S. IPO Filings and Proceeds, by Year (Minimum $50M Market Cap)

Bar Chart Showing U.S. IPO Filings and Proceeds, by Year (Minimum $50M Market Cap)
Source: Renaissance Capital. Data as of November 25, 2025. Past performance is not a reliable indicator or guarantee of future results. Data include IPOs and direct listings with a market cap of at least $50mm. Excludes closed-end funds, unit offerings, and SPACs.

The resurgence is driven primarily by strategic M&A, with large companies acquiring smaller ones within their industries. This type of activity stalled near the end of the previous administration due to regulatory uncertainty and lengthy approval timelines. Today, those barriers have eased, enabling deals such as a major cybersecurity acquisition earlier this year and increased activity in biotech, where large pharmaceutical firms are buying smaller innovators.

The IPO market tells a similar story. Strong offerings in 2024 set the stage for momentum, and history suggests that successful IPOs beget more IPOs. As confidence builds, venture-backed firms are increasingly willing to enter public markets. While the secular trend of companies staying private remains intact, driven by regulatory burdens, the cyclical backdrop is shifting. Following the bear market that ended in 2022, valuations have recovered, and the pipeline for IPOs in 2026 and 2027 looks robust.

Attractive Opportunities Outside of the United States

Despite recent volatility following tariff announcements and geopolitical uncertainty, global markets remain compelling. Earnings have been the key driver, with roughly 90% of share price movements correlated to earnings trends, according to Factset. The earnings of the MSCI Europe, Australasia, and Far East (EAFE) Index and MSCI Emerging Markets (EM) Index have both accelerated to high-single-digit and low-double-digit growth in 2025, narrowing the gap with U.S. equities, and are projected to grow low to mid-double-digits in 2026 (see Figure 6). 

Figure 6. Strong Earnings Estimates Across Developed and Emerging Markets

Year-over-year earnings per share (EPS) growth

Bar Chart Showing Year-over-year earnings per share (EPS) growth
Source: Factset. Data as of November 30, 2025. Past performance is not a reliable indicator or guarantee of future results. Earnings estimates are in local currency. For illustrative purposes only. The index data provided is not representative of any Lord Abbett product. There is no guarantee these forecasts will be achieved.

Opportunities are emerging across regions, particularly in Japan and Korea, but the focus remains bottom-up on multinational companies with global reach rather than country-specific allocations. Key global themes mirror U.S. trends, such as AI adoption, infrastructure rebuilding tied to near-shoring, and rising defense spending outside of the U.S. We believe this approach better positions investors to capture growth across diverse sectors, while mitigating geopolitical risk.

Market Breadth and Small-Cap Strength

The dominance of the Magnificent (Mag) Seven has moderated. While these mega-capitalization (cap) leaders continue to perform well, earnings growth is broadening (see Figure 7). Small-cap earnings for the Russell 2000 Index are up 15% this quarter, marking their best performance in four years and narrowing the gap with large caps.

In 2024, Mag 7 earnings surged over 35%, while small caps posted negative growth. Today, Mag 7 growth has decelerated to the high 20s, while small caps are rebounding strongly. This shift signals healthier market breadth and creates opportunities beyond the largest names.

Figure 7. Earnings Expected to Continue to Broaden Beyond the Magnificent 7

Year-over-year EPS growth

Bar Chart Showing Year-over-year EPS growth
Source: FactSet and Bloomberg. Data as of November 30, 2025. Past performance is not a reliable indicator or guarantee of future results. The index data provided are not representative of any Lord Abbett product. There is no guarantee these forecasts will be achieved.

Trends that Could Support Equity Market Resilience

The ripple effects of AI investment are no longer confined to mega-cap tech. While hyperscalers dominate headlines with multi-billion-dollar CapEx programs, the potential benefits extend across the value chain—semiconductors, cloud infrastructure, cybersecurity, and even industrials tied to data center construction. Mid-cap and select small-cap companies are increasingly reporting productivity gains and margin expansion from AI adoption. This creates a multi-layered earnings tailwind that could continue to broaden market opportunities.

Historically, valuation bubbles have burst during aggressive tightening cycles. Today’s backdrop is markedly different with the Fed signaling a bias toward easing if inflation remains favorable. Lower rates reduce discount rates for equities, support higher valuations, and ease financial conditions for both corporates and consumers. In addition, global central banks remain accommodative, reinforcing liquidity across markets.

Current earnings yield on the S&P 500 is approximately 4.5%, comfortably above the 10-year Treasury yield, at about 4%. This relative attractiveness contrasts sharply with the 2000 tech bubble, when the earnings yield was just 3.5% and Treasuries yielded 6.5%. Today’s environment suggests room for multiple expansion, particularly if earnings growth persists.

Investor positioning remains cautious despite strong year-to-date returns, with many still underweight equities relative to historical norms. This creates a “wall of worry” dynamic, where incremental positive data, such as stable labor markets, easing inflation, and robust CapEx return-on-investment (ROI), can help to drive fresh inflows. Combined with improving M&A and IPO activity, these factors point to a healthier risk appetite and the potential for upside surprises looking ahead in 2026.

Key Points

  • We believe the overall private credit market is well positioned heading into 2026, given the more constructive environment for M&A deals that developed in the second half of 2025.
  • Spreads tightened despite lower interest rates in the wake of two U.S. Federal Reserve rate cuts and headlines around two high-profile defaults in the broadly syndicated loan market, but they may be positioned to widen in the new year.
  • Other factors to watch in the coming year include the market impact of payment-in-kind (PIK) deals and the potential for greater differentiation in performance of managed credit portfolios. 

Following a slowdown in deal flow in the wake of the April 2 U.S. tariff announcement, the private credit market saw a revival of activity in the third and fourth quarters of 2025, although the pace remained below the highest levels of 2024. The market’s initial concerns about the economic impact of the proposed levies on U.S. trading partners were mitigated by subsequent modifications to the terms of the tariffs by the U.S. administration.

Developments in the interest-rate environment also influenced the market. The pace of merger and acquisition (M&A) activity, a key component of middle-market direct lending, slowed due to a post-April 2 increase in interest rates. Higher rates tend to discourage M&A transactions because they lead to increases in the discount rate–the rate of return a company requires to justify an investment, based on expected future cash flows–which decreases the present value of an acquisition candidate.

A subsequent reduction in interest rates, reflecting rate cuts by the U.S. Federal Reserve in September and October, resulted in a second-half revival in M&A activity and increase in volumes of newly issued loans. Indeed, according to Morgan Stanley, M&A deal volume logged a significant quarter-over-quarter increase in the third quarter, with early indications that the trend would continue in the fourth quarter.3

Credit Conditions, Rate Moves and Spread: Current Dynamics

One other noteworthy development in the market was the occurrence of two widely publicized credit events in September: defaults by auto-parts supplier First Brands and subprime auto lender and retailer Tricolor. While the loans for both issuers were not originated in the private credit market but were traded publicly in the broadly syndicated loan market, and the defaults may have been attributable to company-specific factors rather than general market conditions, they still raised questions about the credit standing of corporate loan issuers in general.

The two defaults—and the renewed focus on overall credit conditions—were one of several factors poised to influence spreads in the later part of the year. The increase in deal volume and the lower level of interest rates referenced earlier were both conditions that could be expected to widen spreads.

The latter factor is worth a closer look. Fed rate cuts tend to have outward pressure on spreads for two reasons. One, lower base rates mean lower yield overall, and spreads may widen somewhat to make up for that. Second, the reason why the Fed would cut rates in the first place is a moderation in economic activity, which has also historically been a factor in spread widening.

With all these factors in play, spreads should have widened in the second half. But perhaps counterintuitively, they tightened. Why? One reason might be that private markets are slower to respond to these types of developments than their public counterparts, somewhat like a battleship turning around in a harbor. We do think these spread-widening pressures will continue into next year, potentially affecting how deals will be negotiated.

Potential Tailwinds for Private Credit

Given those factors, we believe the overall private credit market is well positioned heading into the new year. In addition to the more conducive deal environment (buyers and sellers getting closer in price as they agree on where interest rates are headed), there may be additional impetus for M&A deals from private equity firms looking to realize value from prior deals.

Note that the average length of time that private equity firms hold investments has gone from three and one-half years to almost seven years. The limited partner investors in these deals may want to see their capital returned. Looking at current deal pipelines, it appears that the combination of the normalization in interest rates, along with investor demand to get a return of capital, is causing an increase in M&A activity. We think these conditions present a good target environment for lenders.

We would note other factors poised to drive demand for private credit in the coming year. Take a look at Figure 8. The upper panel shows a high level of “dry powder” at private equity firms, suggesting significant demand for private debt capital to finance future PE-backed transactions. The lower panel depicts a looming “maturity wall” for borrowers across leveraged finance markets that may spur a wave of refinancing activity.

Figure 8. Two Potentially Supportive Technical Trends for Private Credit in 2026

1. Historically High Levels of “Dry Powder” for Private Equity Firms to Deploy

Mountain Chart Showing Historically High Levels of “Dry Powder” for Private Equity Firms to Deploy

2. Borrowers in Leveraged Credit Markets Face a Near-Term "Maturity Wall"

Bar Chart Showing Borrowers in Leveraged Credit Markets Face a Near-Term "Maturity Wall"
Source: Preqin. Data as of September 30, 2025. Latest available data. High yield and bank loan debt data based on ICE BofA Index data and private credit debt data derived from Pitchbook as of March 31, 2025. Latest available. For illustrative purposes only. The index data provided is not representative of any Lord Abbett product.

Two Other Factors to Watch in the Coming Year

Payment-in-kind (PIK). We have previously written about PIK deals, where the borrower capitalizes some or all of the interest due on a loan. When the PIK feature is used, the borrower doesn’t make all of their interest payment in a given quarter; the amount that they do not pay gets added to their principal, and so they're then paying interest on a higher principal amount over time. According to a November 2025 report from PitchBook, PIK interest income amounted to 8.3% of total interest income at the top 15 business development companies in the second quarter of 2025. Overall, we consider PIK to be a credit negative, as it shows that a company is probably tight on liquidity.

Differentiation in private credit portfolios. With the return of more normal levels of deal flow, and the ongoing concerns about issuer credit and potential defaults, we believe there will be a greater degree of differentiation in managed private credit portfolios. We have not had a true credit cycle for some time; should default rates pick up noticeably, we believe portfolios will behave very differently.

A Final Word

We made this point in our 2025 midyear update on the market, and we think it bears repeating as we enter 2026: We believe capital formation around private strategies will continue to grow, and the market will continue to evolve. As that evolution occurs, asset managers will have increasing opportunities to differentiate themselves, as credit research and underwriting expertise will come to the fore.

Key Points

  • Municipal bonds yields remained near their highest levels in a decade during 2025 and remain attractive as the new year begins.
  • The market has been supported by the overall strong credit quality of municipal issuers, a trend we see continuing in 2026.
  • As for the municipal yield curve, all maturities are attractive, in our view, but for those comfortable with the potential volatility, the long end represents strong relative value.

The municipal bond market earned positive returns during 2025 despite underperforming many other fixed income markets, while current fundamental and technical factors suggest a positive backdrop for 2026.

At the start of 2025, municipal yields were near their highest level in 10 years. As 2025 draws to a close, yields remain at near multi-year highs across all maturities of the yield curve for both investment-grade and high yield municipal bonds. For example, as of December 1, 25- to 30-year AA-rated bonds were yielding 4.1% or higher, which, when adjusted for taxes, represented a tax-equivalent yield of approximately 7.4% to 7.5%.4 Meanwhile, AAA-rated municipal bonds in this maturity range offered yields of about 4.0% to 4.1%, representing a tax-equivalent yield of approximately 6.8% to 6.9%. These tax-equivalents yields are close to the historical returns of equity market, suggesting an interesting comparison of relative performance.

While all maturities in the municipal yield curve represent good value, in our view, the most attractive opportunities remain at the longer end. We featured a version of Figure 9 in our midyear update: The municipal bond yield curve from a tax-equivalent perspective relative to the U.S. Treasury yield curve. AAA municipals offer higher after-tax yield than Treasuries across all maturities, and the municipal yield curve remains much steeper than the Treasury curve, making munis one area of fixed income where it may make sense for investors to extend duration. (Note that there is no guarantee that these conditions will continue in the future.)

Figure 9. Municipal Curve Continues to Offer Historically Attractive Tax-Equivalent Yields

Line Chart Showing Tax-equivalent yield (%) as of December 1, 2025
Source: Bloomberg. Data as of December 1, 2025. Muni AAA tax-equivalent yield refers to taxable-equivalent yields on AAA-rated municipal bonds of corresponding maturity. “Treasury” refers to yields on U.S. Treasury securities of corresponding maturities. The tax-equivalent yield is the return that a taxable bond would need in order to equal the yield on a comparable tax-exempt municipal bond. Taxable-equivalent yield assumes the top marginal tax bracket of 40.8%, which includes the 37.0% income tax rate and the 3.8% in Medicare tax. Past performance is not a reliable indicator or guarantee of future results. For illustrative purposes only and does not represent any specific portfolio managed by Lord Abbett or any particular investment. Indexes are unmanaged, do not reflect the deduction of fees or expenses, and are not available for direct investment.

Tracking Supply and Demand Conditions

As the year started, the market was coming off a record supply of newly issued municipal bonds of around $500 billion in 2024; as of December 1, supply for 2025 had exceeded that amount, reaching around $548 billion, based on Bloomberg data, representing another record year. While the record issuance is helpful in meeting infrastructure and refinancing needs for issuers, it does place some pressure on municipal yields. Despite the elevated supply over the past couple of years, the supply of outstanding municipal bonds has only increased about 10% over the past decade, while the amount of U.S. Treasury bonds has more than doubled. We believe that as fiscal and monetary policy uncertainty continues to improve, supply will remain somewhat above the long-term average, but the market should handle it well.

On the demand side, the picture was mixed in 2025. Demand from separately managed accounts continued to be strong, especially for bonds with maturities of 10 years or shorter. Muni-bond mutual funds typically drive demand for bonds in the longer part of the curve. While mutual fund flows have been positive overall, demand has been inconsistent and has yet to fully recoup the money that flowed out of the funds during 2022 (see Figure 10).

Figure 10. Municipal Bond Inflows Remain Well Below the Highest Levels of Recent Years

Annual flows into municipal bonds funds (billion US$), 1992-2025 (through November 30)

Bar Chart Showing Annual flows into municipal bonds funds (billion US$), 1992-2025 (through November 30)
Source: London Stock Exchange Group (LSEG) Lipper Global Fund Flows. Data as of November 30, 2025.  For illustrative purposes only and does not represent any specific portfolio managed by Lord Abbett or any particular investment. 

How have these conditions—heavy supply, high demand within 10 years, and lighter demand for other segments of the curve—influenced the market? The short and intermediate parts of the market have performed well, outpacing the longer end, where rates are actually higher from the start of the year. Generally, bonds with maturities shorter than 15 years have seen yields fall, while rates have risen on maturities longer than 15 years. This has driven a significant steepening of the muni yield curve, with the 10- to 30-year segment now near its steepest point in a decade. As a result, municipal bonds currently offer some of the most attractive compensation for extending duration relative to other fixed income sectors, in our view.

Credit Quality Remains Solid

Credit conditions remain strong in the municipal bond market, in our view. As we wrote in a September 2025 commentary, states were heading into the next fiscal year with reserve levels that are near record highs, tax revenues still remain high compared to long-term averages, and the budgeted spending is growing at the slowest rate in more than a decade.

This period of strength comes as states move beyond the stimulus funding received in the wake of the COVID-19 pandemic and are back to depending on their own revenues. In recent years, the upgrade-to-downgrade ratio of municipal issuers by credit rating agencies has been quite strong, with lower credit-quality states such as Illinois and New Jersey receiving significant upgrades. We see some moderation in this trend going forward, due to less room for many credit ratings to rise and economic growth potentially slowing, though the upgrade-to-downgrade ratio should remain positive, and overall credit should be stable.

These actions reflect broad-based strength in municipal credit quality, in our view, extending across general obligation and revenue bonds. We think municipal credit will continue to hold up well in 2026.

Favorable Backdrop for High Yield Munis

The high yield segment of the muni market did not see the strong supply trend that investment-grade bonds experienced. Supply of high yield munis came to the market at average levels during 2025, reflecting the higher interest-rate environment, which reduced borrowing for the types of projects that tapped the market during the lower-rate conditions seen earlier in the decade.

However, that moderation in supply has been met by rising demand, based on data from Lipper. Within muni-bond mutual funds, the biggest demand is for high yield bonds; indeed, the fastest-growing category for muni funds is high yield. This presents a favorable technical backdrop for high yield munis.

From a credit perspective, the high yield muni market appears to be in good shape, with defaults only in the 2% or lower range during 2025, near historical lows and similar to 2024. Also, there appeared to be limited stress in high yield credits, suggesting the potential for defaults to remain low going forward. Meanwhile, spreads on high yield municipal bonds remained attractive, as the high yield index underperformed the investment-grade index. High yield muni bond spreads do not reflect the tightness seen in other fixed income markets, suggesting more attractive valuations for investors seeking higher levels of tax-free income.

Summing Up

As we noted, municipal bond yields remain attractive as we approach the beginning of 2026. With starting yields historically serving as the most reliable indicator of future performance, today’s muni yields suggest some of the most attractive forward return potential seen in the last 10 years. Overall credit quality remains strong, with state finances in generally solid shape, and upgrades continuing to exceed downgrades

Supply has been heavy and may remain at above-average levels, but not too high for the market to handle. While the demand picture is more mixed, as rate volatility eases, fiscal policy uncertainty fades, and the U.S. Federal Reserve progresses further into its rate-cutting cycle, we believe demand is likely to continue to accelerate.

Given the factors outlined here, and the broad array of investment opportunities for those seeking tax-free income, we think municipal bonds are positioned attractively for investors compared to other markets and historical returns.

1 Data sourced from FactSet and Oppenheimer & Co. as of September 30, 2025.

2 Data sourced from Goldman Sachs Research as of November 30, 2025.

3Q3 2025 Update on the M&A Environment,” Morgan Stanley, September 2025.

4 Taxable-equivalent yield assumes the top marginal tax bracket of 40.8%, which includes the 37.0% income tax rate and the 3.8% in Medicare tax.