Higher Interest Rates: What Fixed Income Investors Should Know

Rising rates have repriced the bond market, but resilient economic growth, attractive starting yields, and wide differences in credit performance are creating opportunities for active fixed income investors.

This is a marketing communication.

Interest rates have moved sharply higher in 2026, fundamentally changing the fixed income landscape. Between February 27 and September 30, the 10-year U.S. Treasury yield rose approximately 135 basis points, while two-year yields increased approximately 151 basis points. The yield curve flattened as markets shifted from expecting Federal Reserve (Fed) rate cuts earlier in the year to anticipating additional tightening (data source: Bloomberg, as of the dates noted).

But the reasons behind the rise in rates are important. Unlike 2022, when surging inflation and aggressive Fed tightening drove bond-market volatility, much of the increase in Treasury yields in 2026 has reflected stronger real, or inflation-adjusted, yields. Economic growth has remained resilient, supported by healthy employment, consumer spending, corporate earnings, and private investment. Inflation expectations, meanwhile, have accounted for a smaller portion of the rise in nominal yields. These differences help to explain why credit markets have remained relatively more stable despite the significant repricing of interest rates (see Figure 1).

The 10-year Treasury yield increased from 4.17% at the beginning of 2026 to 5.28% at the end of September. Over the same period, investment-grade corporate option-adjusted spreads moved only from 78 to 80 basis points, while high yield spreads widened from 281 to 312 basis points. The divergence suggests that higher rates may not have led to credit deterioration, as resilient growth has helped corporate borrowers absorb higher financing costs, though the impact varies by issuer.
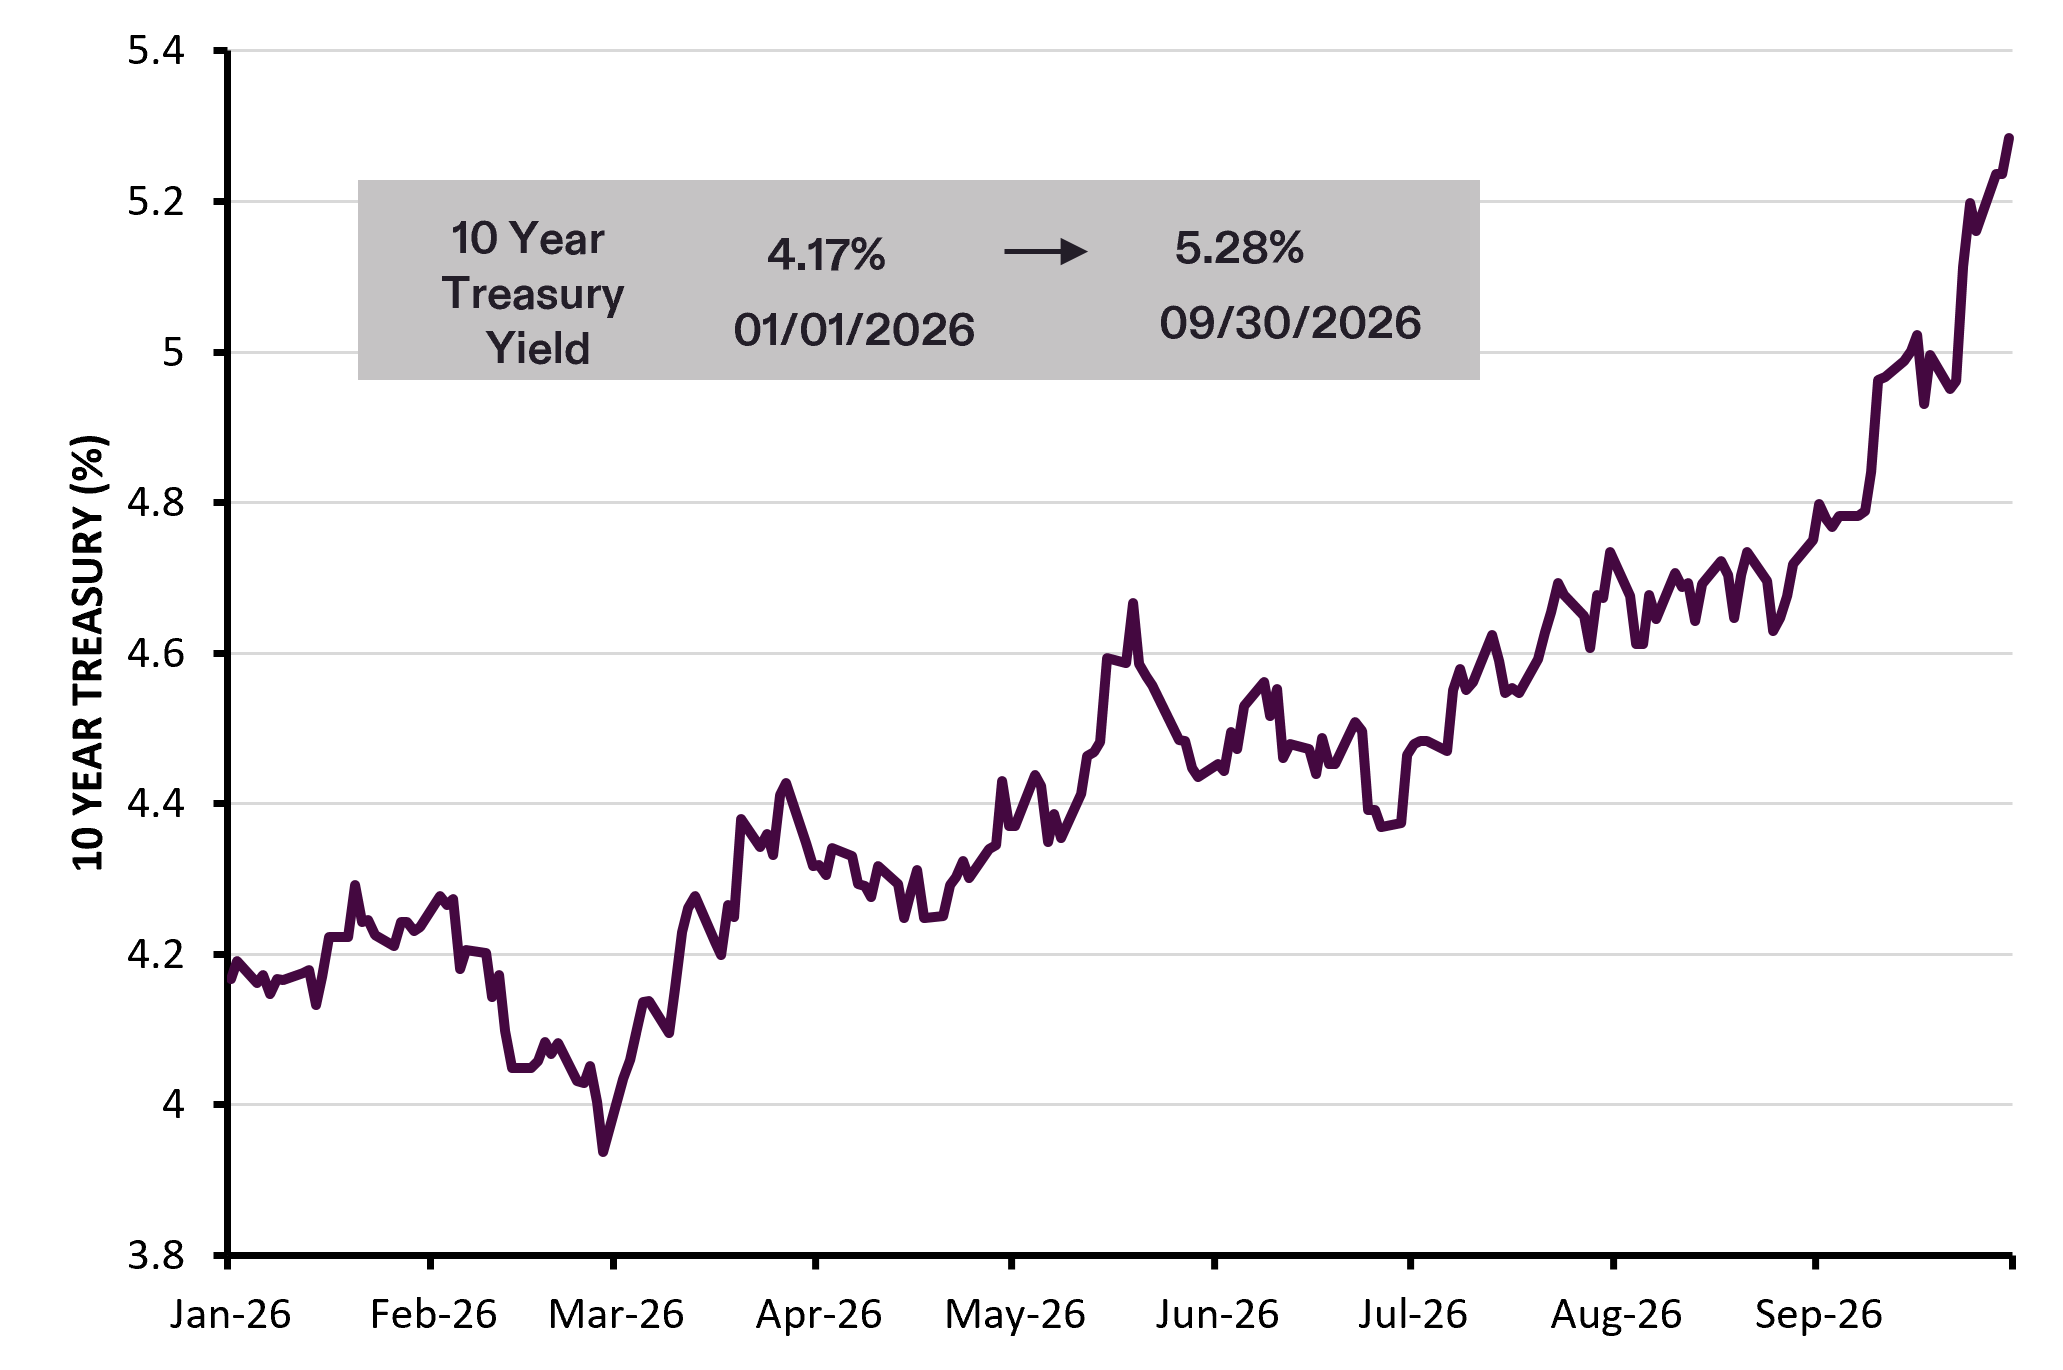
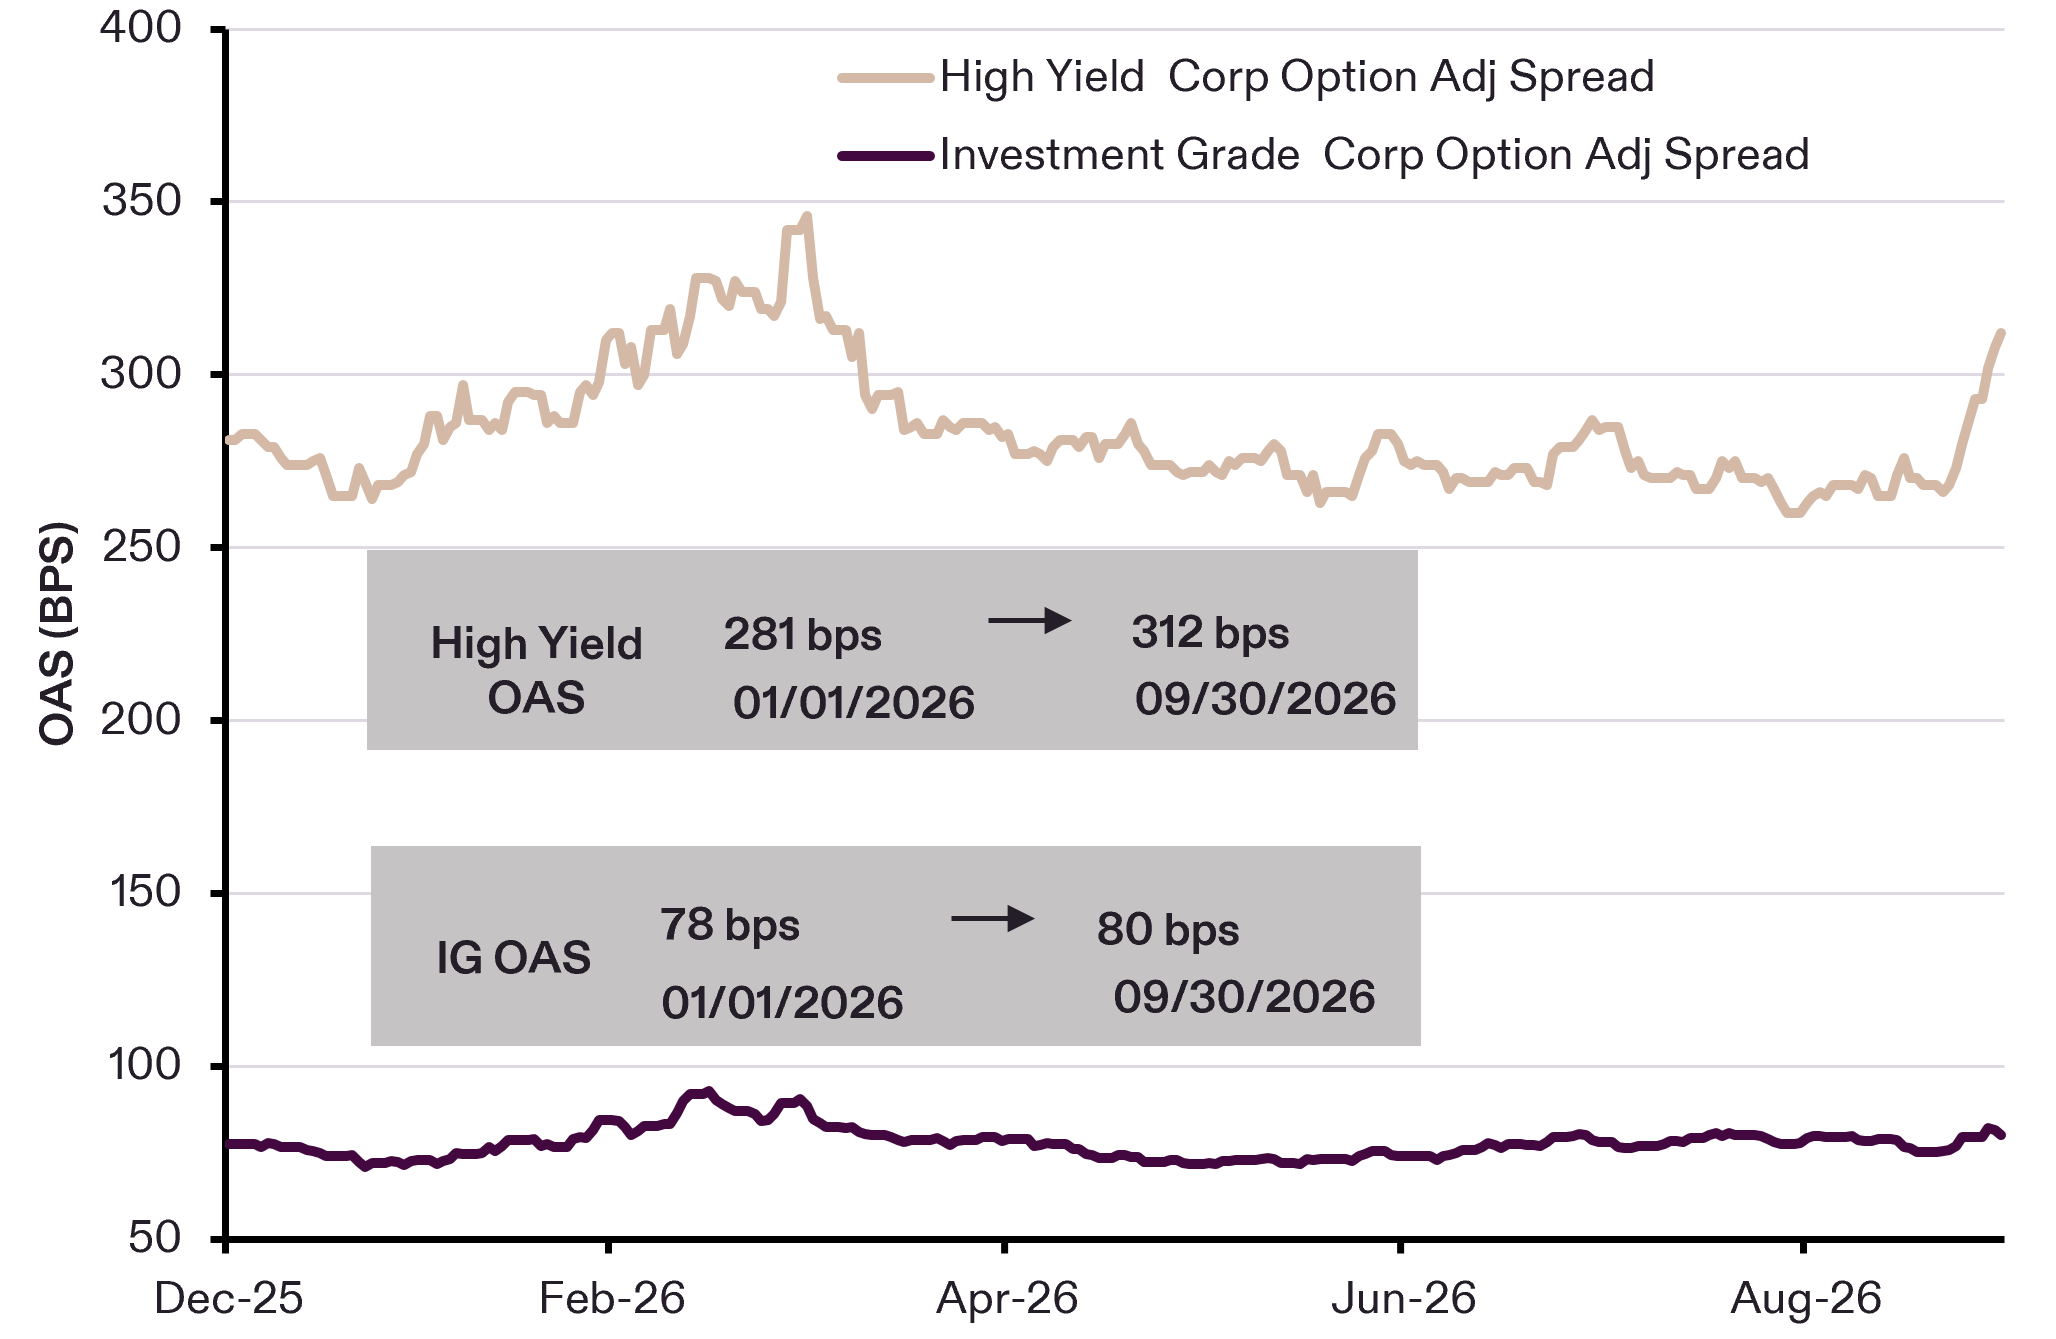
Figure 1. 10-Year Treasury Has Risen; Credit Spreads Remained Relatively Stable

10-year U.S. Treasury Yield, (top panel), and index option-adjusted spreads (OAS), (bottom panel), January 1, 2026-September 30, 2026

placeholder
placeholder
Source: Bloomberg. Data as of September 30, 2026. Option-adjusted spread (OAS) is the yield spread of a bond relative to a benchmark, adjusted for any embedded options. OAS helps investors evaluate the relative value of bonds with features that can affect future cash flows, such as call or prepayment provisions. IG=investment grade. High yield is the ICE BofA U.S. High Yield Index. IG is the Bloomberg U.S. Corporate Bond Index. For illustrative purposes only and does not represent any specific portfolio managed by Lord Abbett or any particular investment. Past performance is not a reliable indicator or guarantee of future results. Indexes are unmanaged, do not reflect the deduction of fees or expenses, and are not available for direct investment.

Higher Starting Yields Change the Return Equation

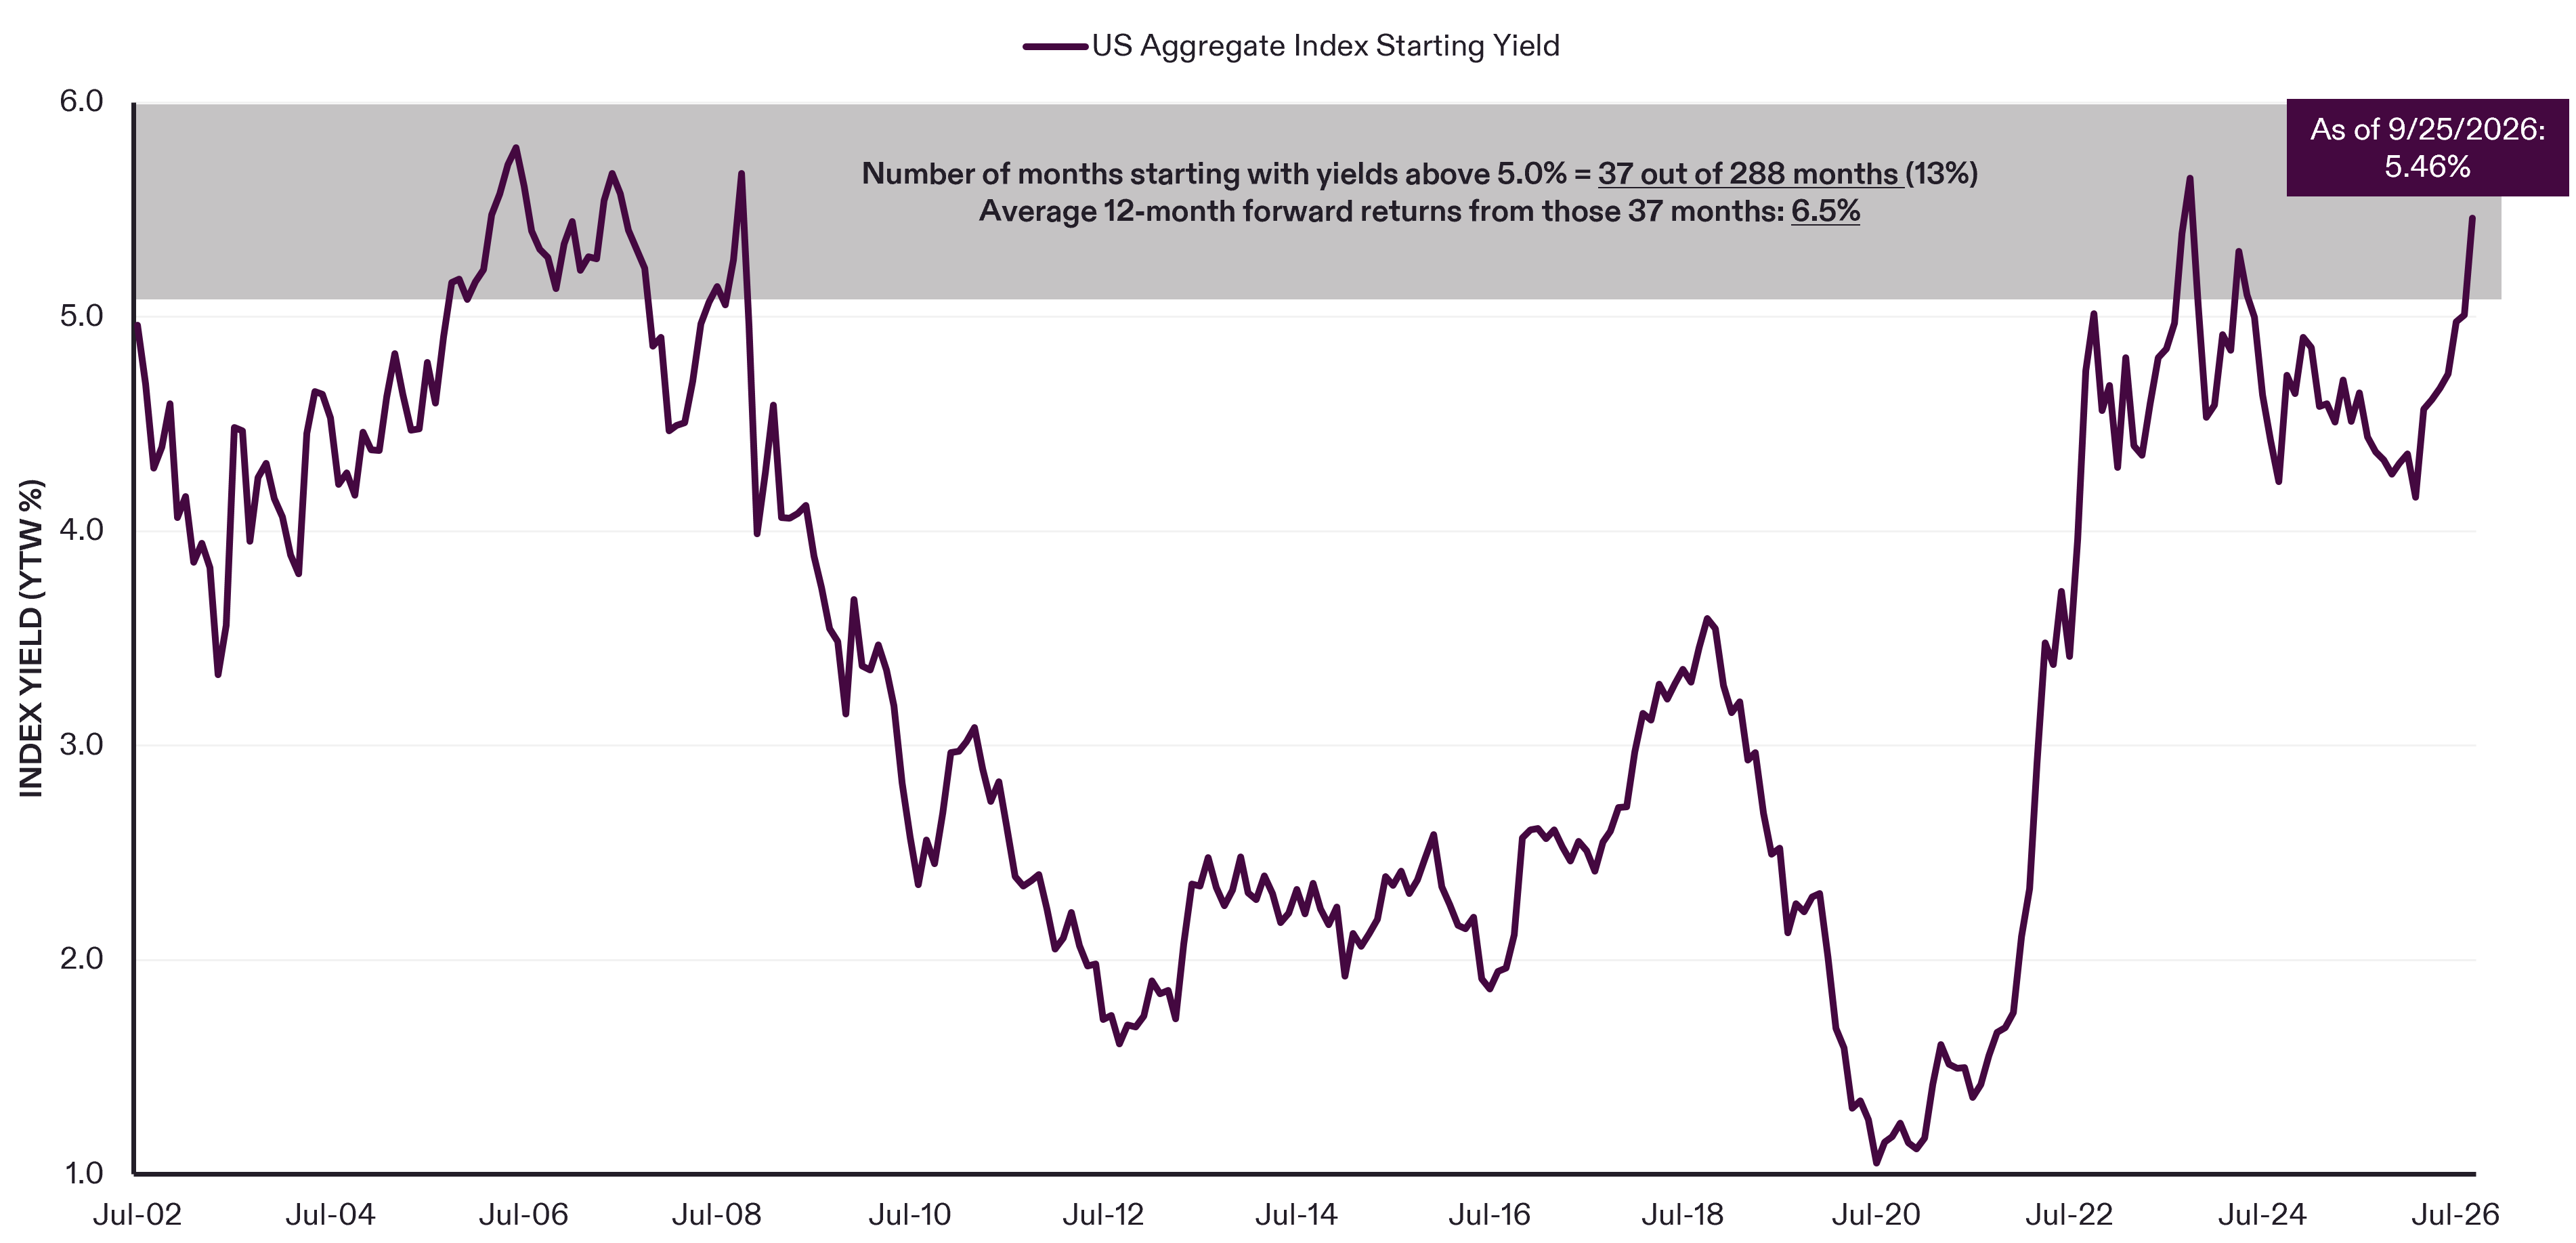
The repricing of interest rates has created a more attractive starting point for fixed income investors, with yields offering greater income opportunities than during much of the post-global-financial-crisis period (see Figure 2). That income can help offset some of the negative price impact if rates rise further. A longer-term view of investment grade bond yields, as represented by the Bloomberg U.S. Aggregate Bond Index, shows elevated yields that have reached near their highest levels in two decades. Over the past 24 years, starting yields on the Bloomberg U.S. Aggregate Bond Index exceeded 5% in just 13% of months (37 of 288), with those periods followed by an average 12-month return of 6.5%.

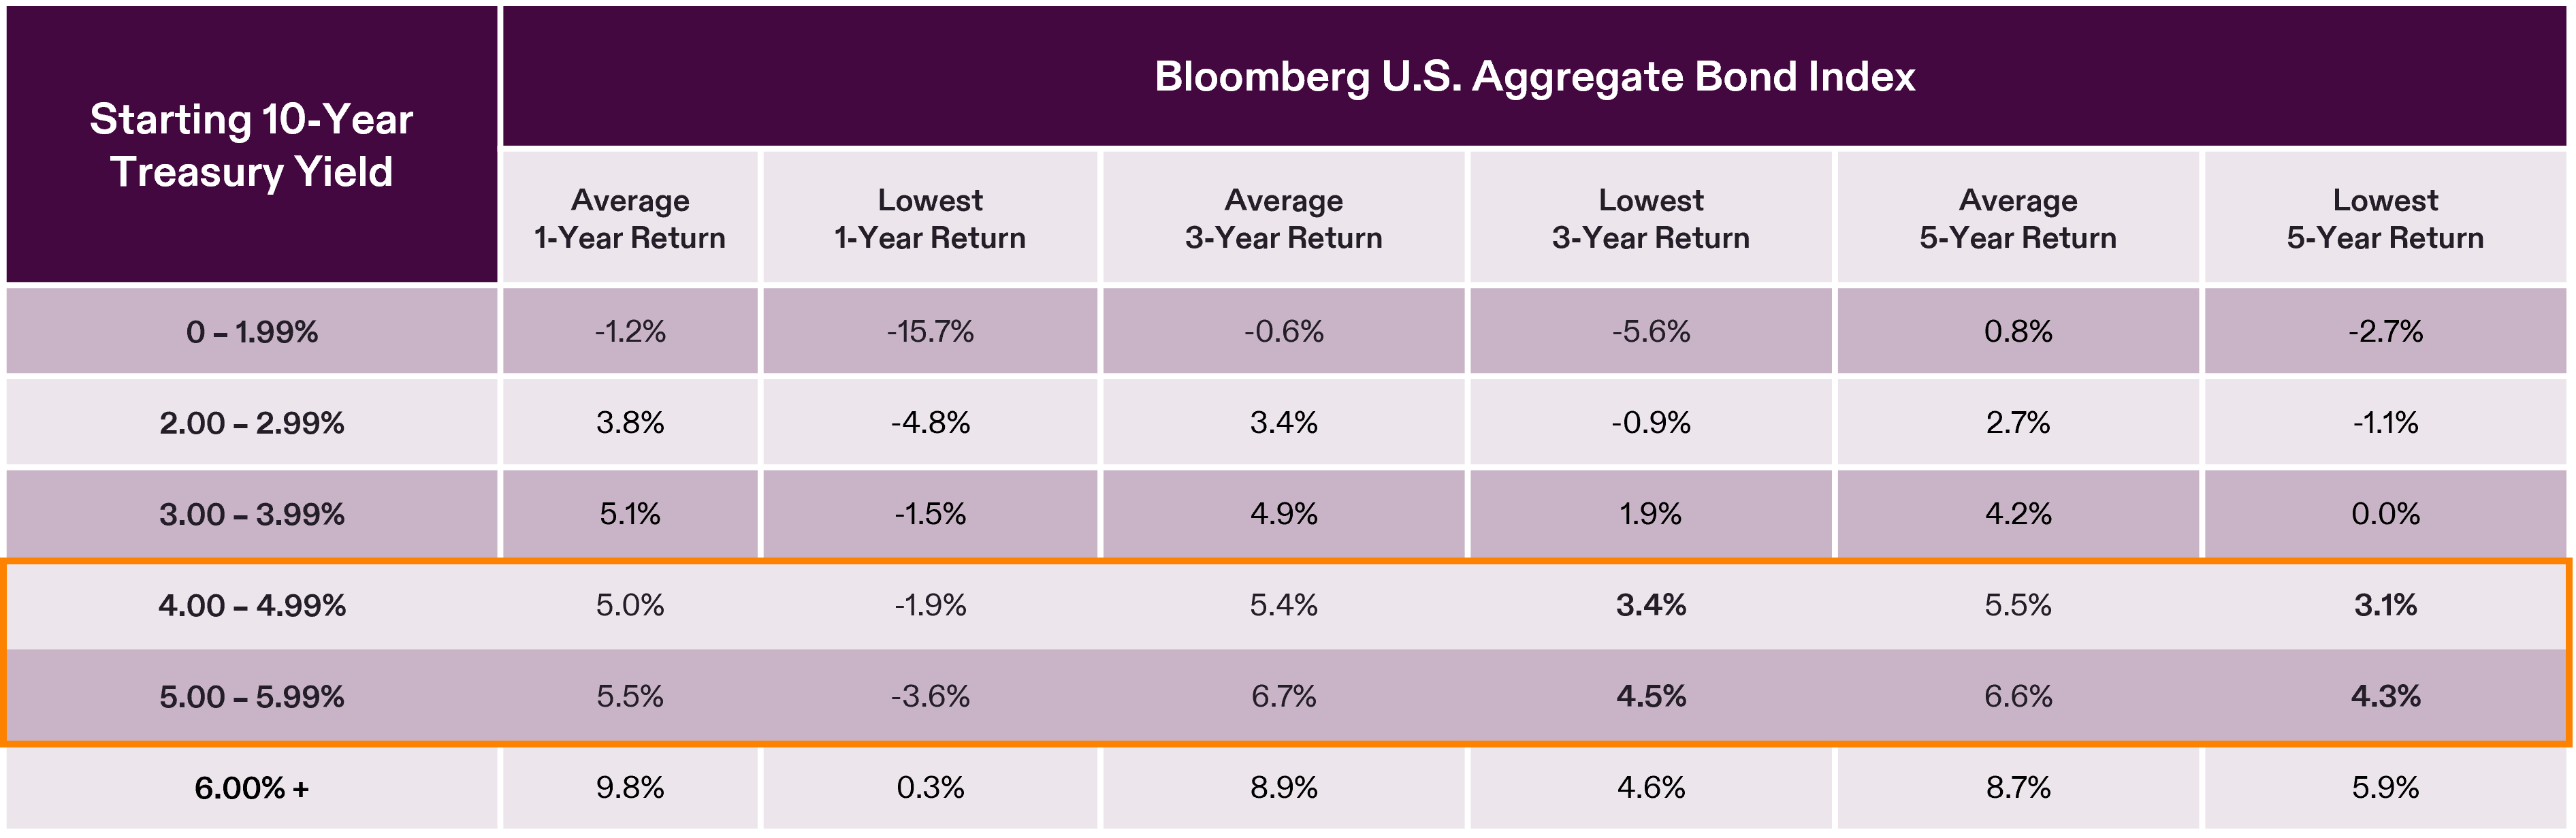
Historical returns have supported the importance of the starting yield level. When the 10-year Treasury yield began between 5% and 5.99%, the Bloomberg U.S. Aggregate Bond Index subsequently generated average annualized returns of 6.7% over three years and 6.6% over five years, based on monthly observations from 1986 through 2026 (see Figure 2).
 

Figure 2. Bond Yields Near Long-Term Highs Support Stronger Return Potential

Bloomberg U.S. Aggregate Bond Index yield to worst, top panel, (July 31, 2002-September 25, 2026) and the 10-year U.S. Treasury yield versus the Bloomberg U.S. Aggregate Bond Index trailing returns, bottom panel (January 1, 1986-September 30, 2026)

placeholder
placeholder
Source: Bloomberg. Data as of September 25, 2026 (top panel) and September 30, 2026 (bottom panel). Calculations using monthly observations. For illustrative purposes only and does not represent any specific portfolio managed by Lord Abbett or any particular investment. Past performance is not a reliable indicator or guarantee of future results. Indexes are unmanaged, do not reflect the deduction of fees or expenses, and are not available for direct investment.

Credit Dispersion Offers Opportunities for Active Selection

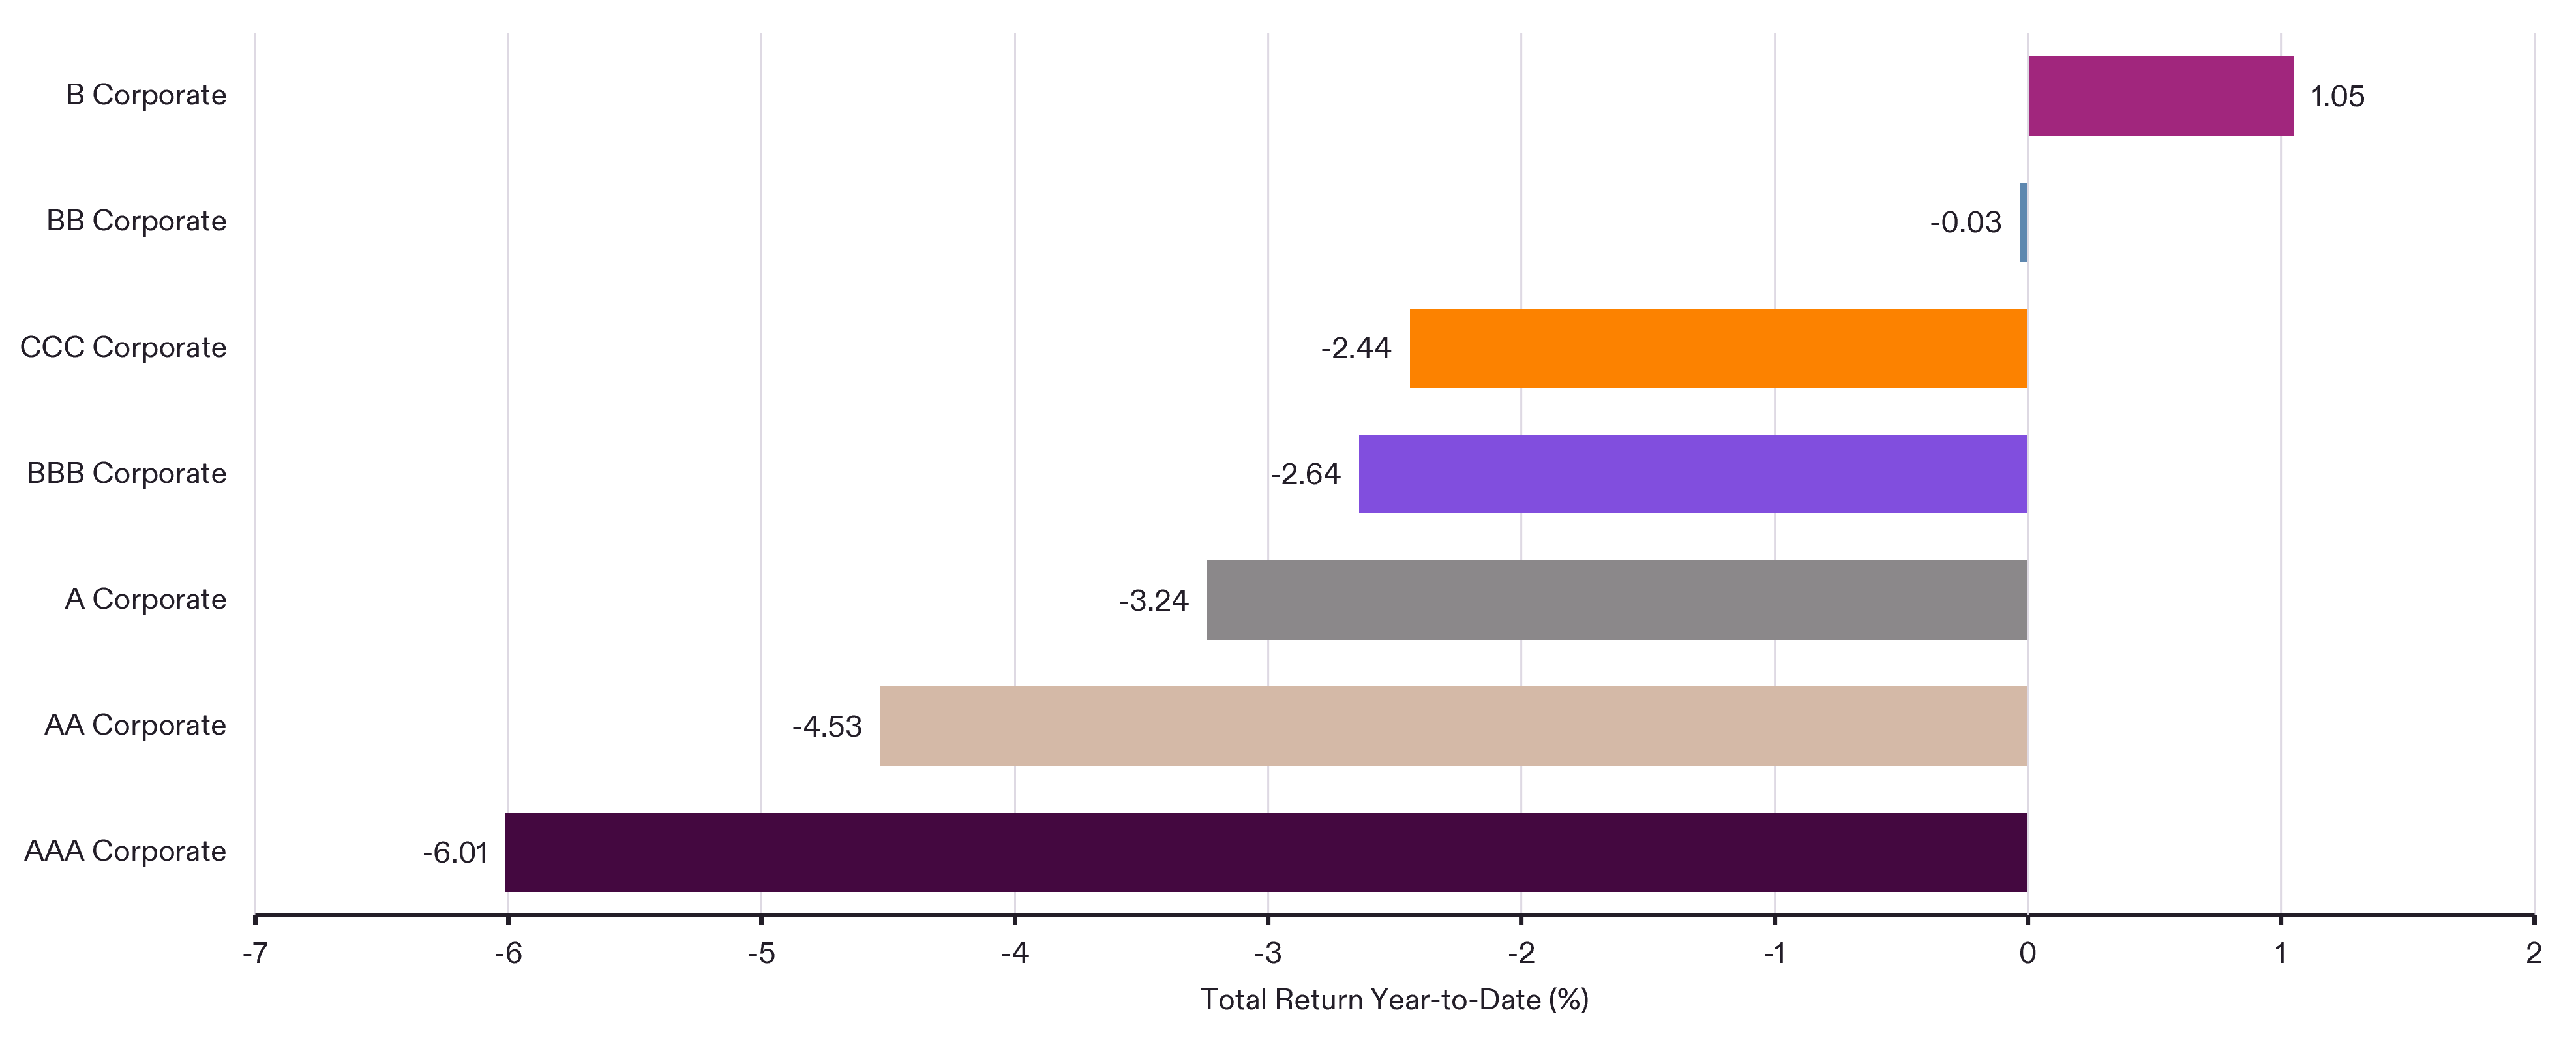
Although credit spreads have remained relatively stable at the index level, performance beneath the surface has varied. As of September 30, 2026, the gap between the best- and worst-performing corporate credit rating segments was over 700 basis points (see Figure 3) Single-B corporate bonds delivered a positive year-to-date return of 1.05%, while AAA-rated corporates returned -6.01%. Differences across industries within high yield have also been substantial.

These differences reflect the interplay between interest-rate sensitivity and credit risk. Investment grade bonds generally have greater exposure to rate movements, while high yield, which typically has shorter duration, can benefit from resilient economic growth. But capturing the attractive yields offered in these segments requires selectivity. In a higher-for-longer rate environment, the weakest borrowers may struggle with elevated financing costs, particularly those with highly leveraged capital structures or limited ability to refinance debt.

The opportunity lies in the distinction between credits that can potentially perform well versus those where higher rates may create financial pressure. This can be especially important across high yield, where credit quality, industry fundamentals, and issuer-specific risks can produce varying investment outcomes.
 

Figure 3. Wide Performance Gaps Highlight the Value of Credit Selection

Index returns by credit-quality segment, January 1, 2026-September 30, 2026

placeholder
Source: Morningstar. Data as of September 30, 2026. BB Corporate, B Corporate, CCC Corporate represented by the ICE BofA U.S. High yield Constrained Index. AAA Corporate, AA Corporate, A Corporate, and BBB Corporate represented by the Bloomberg U.S. Corporate Bond Index. For illustrative purposes only and does not represent any specific portfolio managed by Lord Abbett or any particular investment. Past performance is not a reliable indicator or guarantee of future results. Indexes are unmanaged, do not reflect the deduction of fees or expenses, and are not available for direct investment.

Artificial Intelligence May Add Another Dimension and Opportunity

The AI infrastructure buildout offers a timely example of how sector expertise and security selection seek to uncover opportunities across fixed income markets. Significant capital requirements are driving issuance from hyperscalers and other companies financing data centers, computing equipment, and related infrastructure. That financing spans investment grade corporate bonds, high yield debt, and project-related structures.

For investment grade investors, large, generally highly-rated technology companies issuing substantial amounts of debt may offer opportunities when new securities come to market at attractive spread concessions. Active managers can evaluate those concessions relative to credit quality and existing market valuations, potentially capturing opportunities as new bonds are issued and repriced.

In high yield, data center construction financing can offer additional yield relative to comparably rated corporate bonds. But the potential return must be evaluated against construction risk, collateral quality, project completion, and refinancing expectations.

Summing Up

Rising rates, driven largely by resilient economic growth, have created attractive starting yields while credit markets have remained relatively stable. Yet wide performance dispersion and new opportunities from AI infrastructure financing continue to reinforce the value of active management. Specialized credit research, duration management, and security selection can help investors capture income and total return opportunities, while seeking to mitigate risks as the market environment changes.

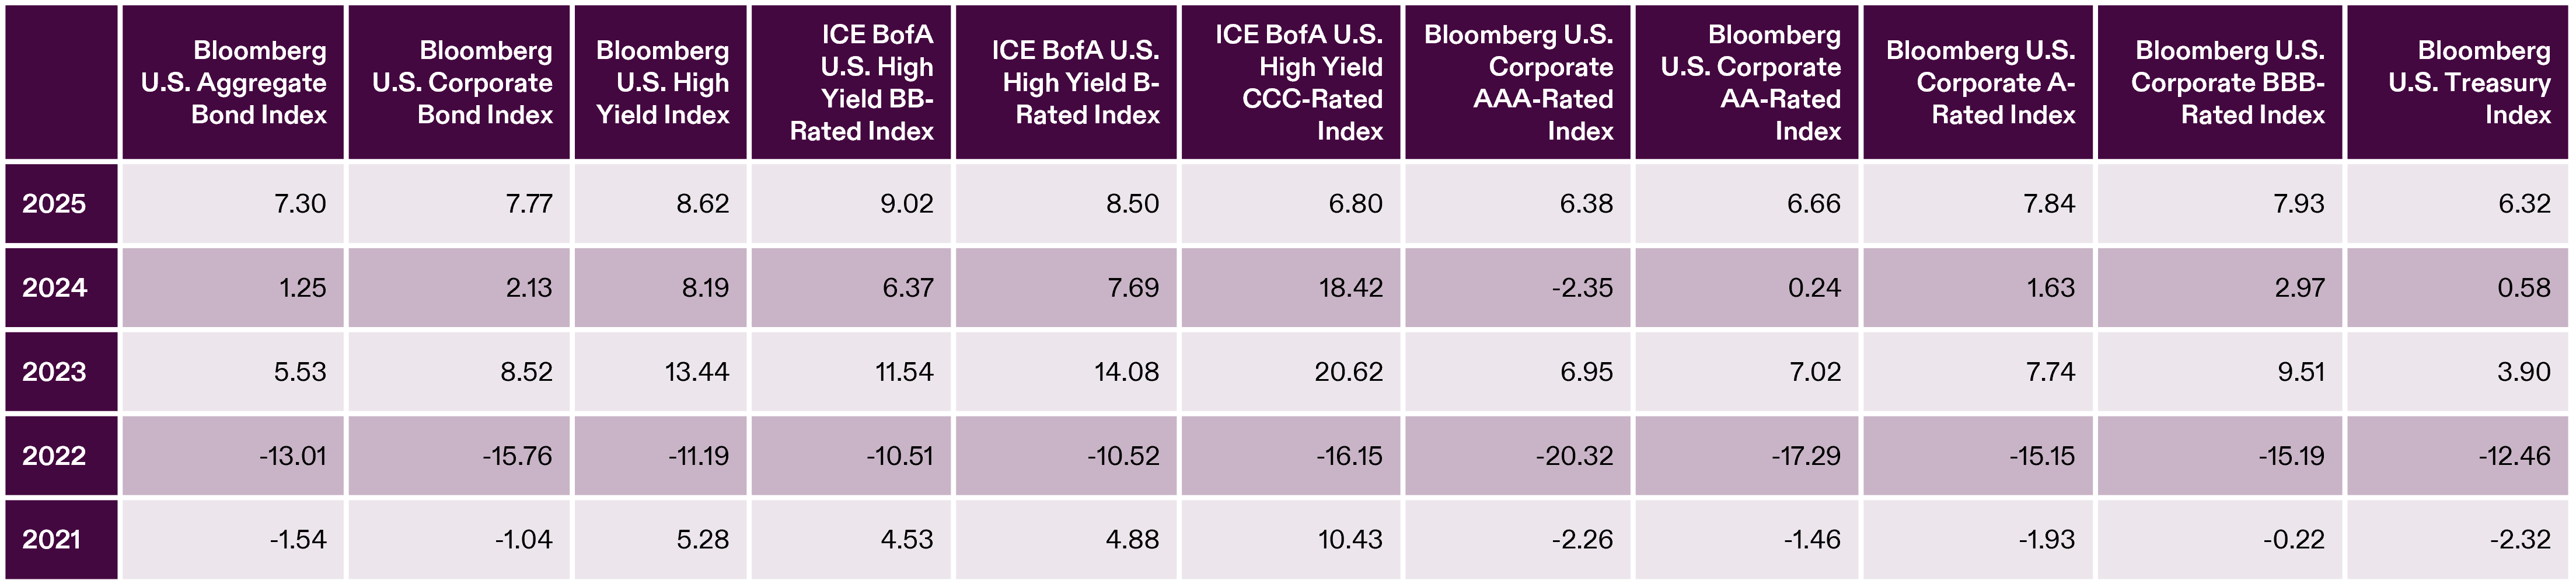
Past Performance of Selected Indices (Calendar Year):

placeholder
NOTE: Past performance is no indication or guarantee of future results.
Source: Bloomberg and ICE Data Indices LLC. Returns shown are expressed in percent. Return data is based on U.S. dollar-denominated index data. Performance of the indices may be affected by changes in the exchange rates between the currency denomination of the indices and any non-U.S. dollar denomination. None of the performance in this table is meant to represent any Lord Abbett products or services.