This is a marketing communication.

Inflation and the accompanying interest-rate volatility that shocked financial markets in 2022 continue to drive investor decision-making today. CLOs have emerged as a new “safe haven” asset class amid the uncertainty, and the attraction makes sense. CLOs have very little duration because the coupon payments float with the Secured Overnight Financing Rate (SOFR) and so are largely insulated from interest-rate volatility. The bulk of CLO debt is high quality, with approximately 65% of the asset class rated AAA, and no CLO tranche rated single-A or higher having ever experienced a loss from default.1 Spreads are typically significantly wider than like-rated corporate debt, leading to attractive relative value.

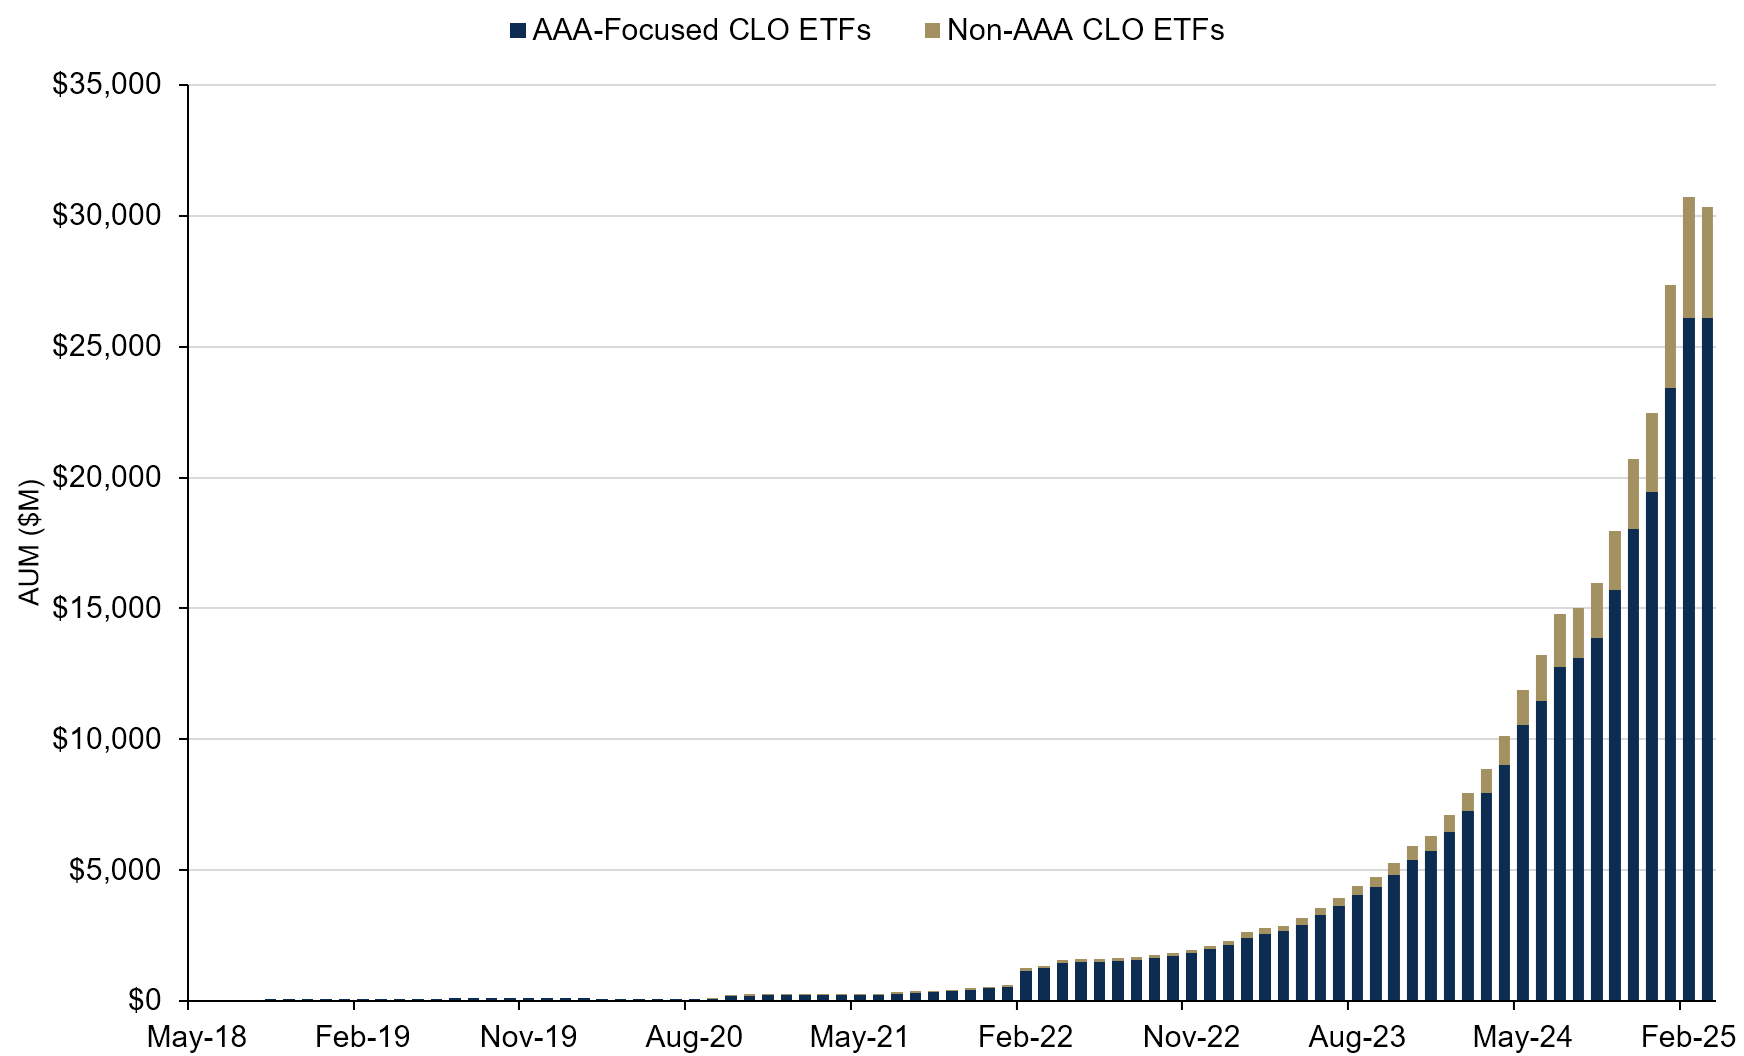
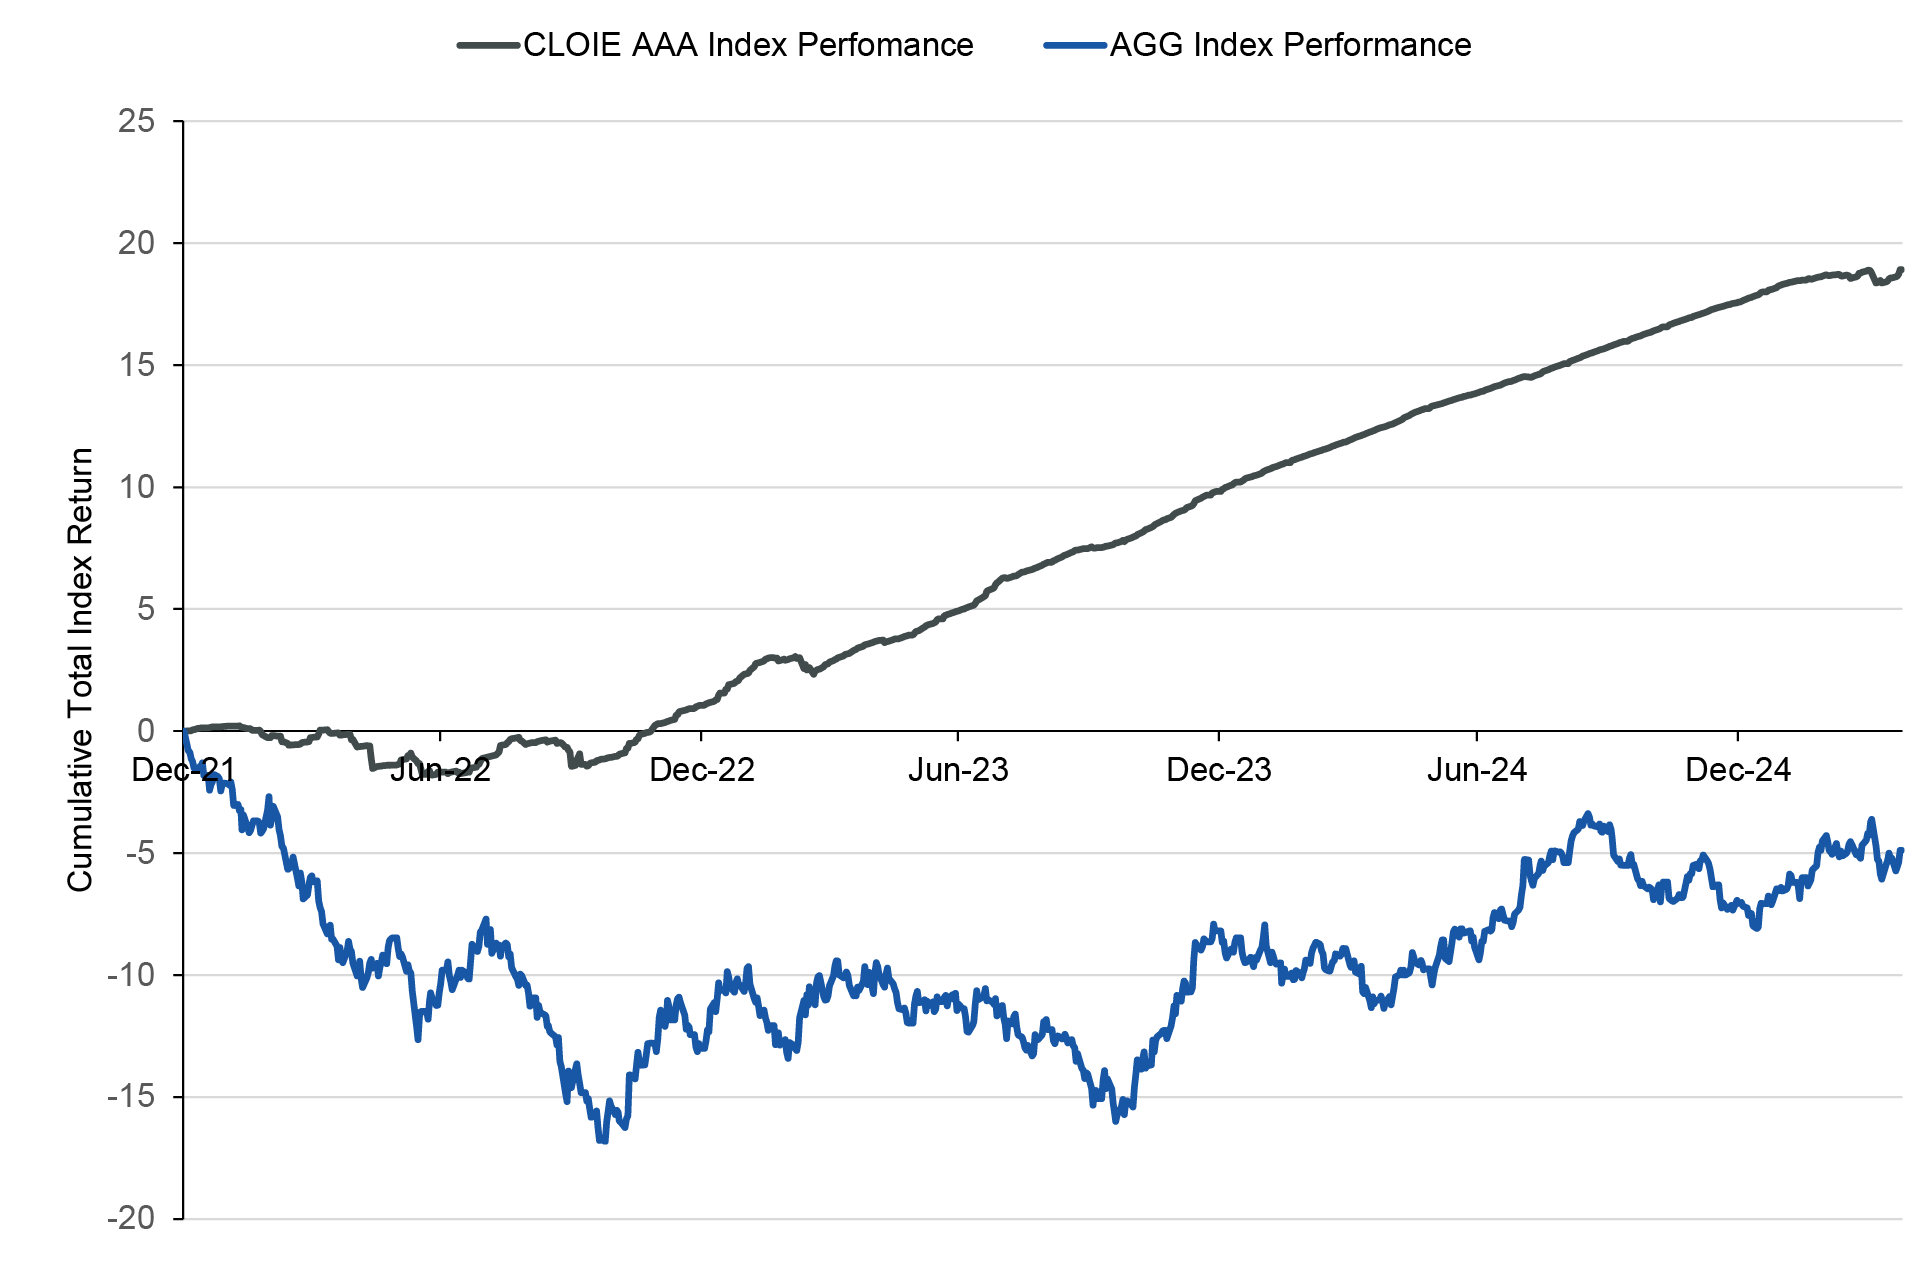
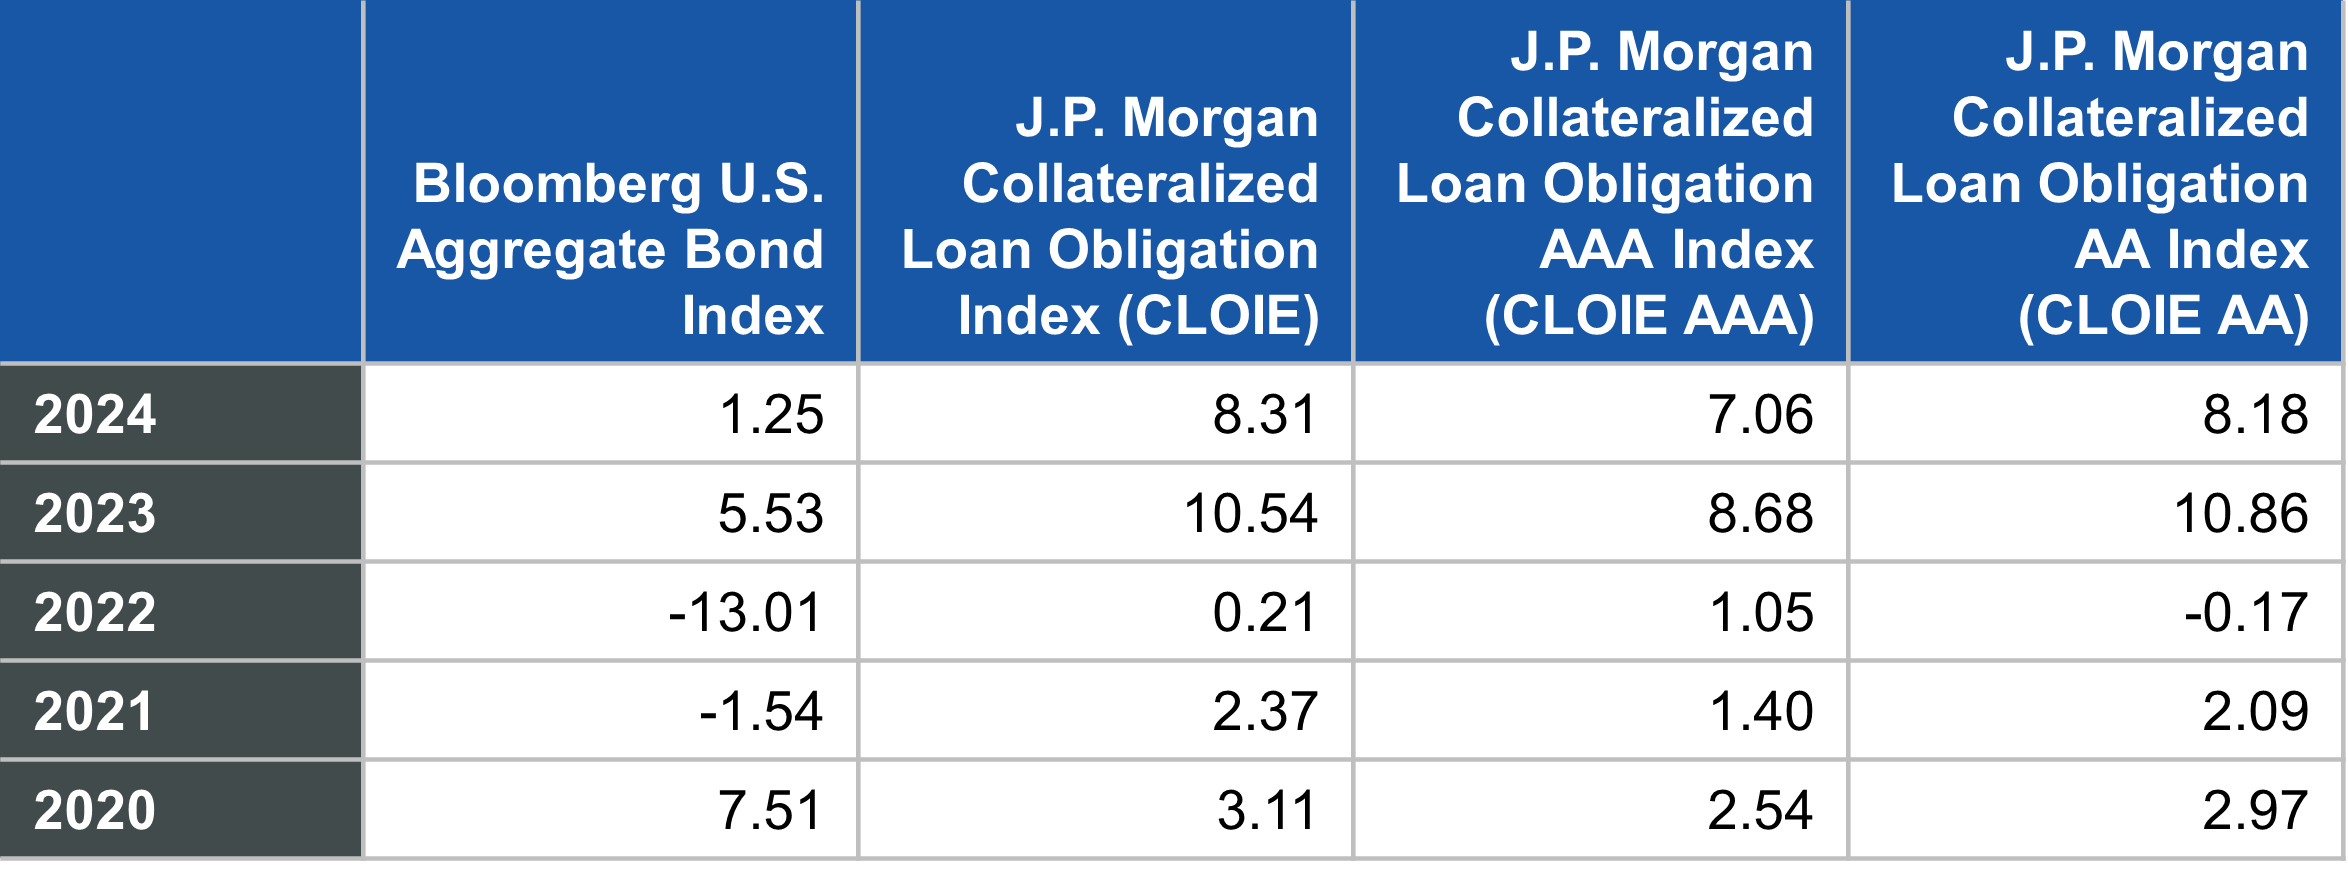
Meanwhile, the emergence of new, convenient exchange-traded fund (ETF) wrappers has made this asset class easy to buy and sell for investors. As a result, flows to AAA CLOs have dramatically increased, while the performance of the AAA CLO index has also been strong, shown in Figure 1.

Figure 1. Strong AAA-Rated CLO AUM Growth and Performance

CLO ETF asset growth, May 31, 2018-March 31, 2025 (top panel), and cumulative performance of the J.P. Morgan AAA-Rated CLO ETF Index versus the Bloomberg U.S. Aggregate Bond Index (AGG), December 31, 2019-April 22, 2025 (bottom panel)

Bar Chart Showing CLO ETF asset growth, May 31, 2018-March 31, 2025
Line Chart Showing cumulative performance of the J.P. Morgan AAA-Rated CLO ETF Index versus the Bloomberg U.S. Aggregate Bond Index (AGG), December 31, 2019-April 22, 2025
Source: Morningstar and Bloomberg. Data as of March 31, 2025 (top panel). Data as of April 25, 2025 (bottom panel). The CLOIE AAA Index is the J.P. Morgan AAA Rated CLO ETF Index, which is a subset of the J.P. Morgan CLOIE Index. It is used to measure the performance of AAA-rated CLO securities. The historical data are for illustrative purposes only, do not represent the performance of any specific portfolio managed by Lord Abbett or any particular investment, and are not intended to predict or depict future results. Investors may experience different results. Due to market volatility, the market may not perform in a similar manner in the future. Indexes are unmanaged, do not reflect the deduction of fees or expenses, and are not available for direct investment. Past performance is no indication or guarantee of future performance.

The newfound popularity of CLOs brings benefits and risks to investors in the asset class. On the benefit side, liquidity of CLOs has never been better. The excess spread in CLOs has always been, at least in part, compensation for lesser liquidity and greater complexity than corporate bonds or Treasuries. However, settlement periods can be lengthy. Navigating this market necessitates in-depth research which requires expensive subscriptions for data on CLO managers and underlying loan portfolios, as well as the expertise and tools needed to analyze and monitor such data, all of which has historically left a small universe of investors. As technology improves, and more participants come to market, it follows that liquidity improves, and some of that “liquidity premium” is reduced.

This reduction in premium reflects some diminishment of risk but also changes market dynamics. The popularity of this floating-rate, high-income solution in a liquid wrapper has swelled CLO ETF assets to over $30 billion, according to Bloomberg, in just over a year of frenzied growth, and largely in AAA-focused strategies. The larger size means ETF flows are starting to have tangible effects on pricing in CLOs, exhibited through both volatility and relative value. Volatility levels have compressed over the last few years, but not nearly as much for the AAA tranche, which has exhibited volatility similar to AA tranches over the last year, while longer-term volatility levels are typically half as much for AAAs, shown in Figure 2.

Figure 2. Demand Changes Near-Term Price Volatility of AAA CLO

J.P. Morgan AAA-rated and AA-rated CLO ETF Index price volatility

Chart Showing Demand Changes Near-Term Price Volatility of AAA CLO
Source: Morningstar. Data as of February 28, 2025. Data in basis points. A basis point is one-hundredth of a percentage point. The CLOIE AAA and CLOIE AA are the J.P. Morgan AAA Rated CLO ETF Index and the J.P. Morgan AA Rated CLO ETF Index. Both are subsets of the J.P. Morgan CLOIE Index. The historical data are for illustrative purposes only, do not represent the performance of any specific portfolio managed by Lord Abbett or any particular investment, and are not intended to predict or depict future results. Investors may experience different results. Due to market volatility, the market may not perform in a similar manner in the future. Indexes are unmanaged, do not reflect the deduction of fees or expenses, and are not available for direct investment. Past performance is no indication or guarantee of future performance. 

Spreads also have compressed over time, but AAA CLO spreads have compressed more, especially during periods of heavy CLO ETF inflows, shown by the ratio of AA to AAA spread increasing during periods of heavy inflows to ETFs, depicted in Figure 3.

Figure 3. ETF Flows Affect Relative Value of CLO Tranches

Monthly CLO ETF flows and spread ratios of AA-rated CLOs to AAA-rated CLOs, March 1, 2023-March 31, 2025

Line and Bar Chart Showing Monthly CLO ETF flows and spread ratios of AA-rated CLOs to AAA-rated CLOs, March 1, 2023-March 31, 2025
Source: Bloomberg and Morningstar. Flows data as of March 31, 2025. Spread ratio as of March 12, 2025. The AAA and AA CLO spread ratio using the J.P. Morgan AAA Rated CLO ETF Index and the J.P. Morgan AA Rated CLO ETF Index. The historical data are for illustrative purposes only, do not represent the performance of any specific portfolio managed by Lord Abbett or any particular investment, and are not intended to predict or depict future results. Investors may experience different results. Due to market volatility, the market may not perform in a similar manner in the future. Indexes are unmanaged, do not reflect the deduction of fees or expenses, and are not available for direct investment. Past performance is no indication or guarantee of future performance. 

It’s clear the outsized flows to AAA CLO strategies have been distorting spreads, temporarily creating better value in other tranches. At times, other flow-related dislocations may make floating-rate, asset-backed securities (ABS) or floating-rate corporate notes more attractive compared to the CLO debt complex. Likewise, market volatility due to tariff policy uncertainly led to meaningful outflows from CLO ETFs in early April, creating some attractive technically-driven relative-value opportunities.

We believe a flexible, active approach can deliver the features of the CLO asset class—low-rate sensitivity and high yields with limited principal risk—while mitigating some of the risk of overpaying due to the popularity of a particular tranche or trade. Flexibility, combined with fundamental credit work, can potentially earn better risk adjusted returns and act as a better ballast for fixed-income portfolios.

Past Performance of Selected Indices (Calendar Year):

Performance Chart

NOTE: Past performance is no indication or guarantee of future results.

Source: Bloomberg and J.P. Morgan. Returns shown are expressed in percent. Return data is based on U.S. dollar-denominated index data. Performance of the indices may be affected by changes in the exchange rates between the currency denomination of the indices and any non-U.S. dollar denomination. None of the performance in this table is meant to represent any Lord Abbett products or services.