This is a marketing communication.

Download the PDF version of this insight

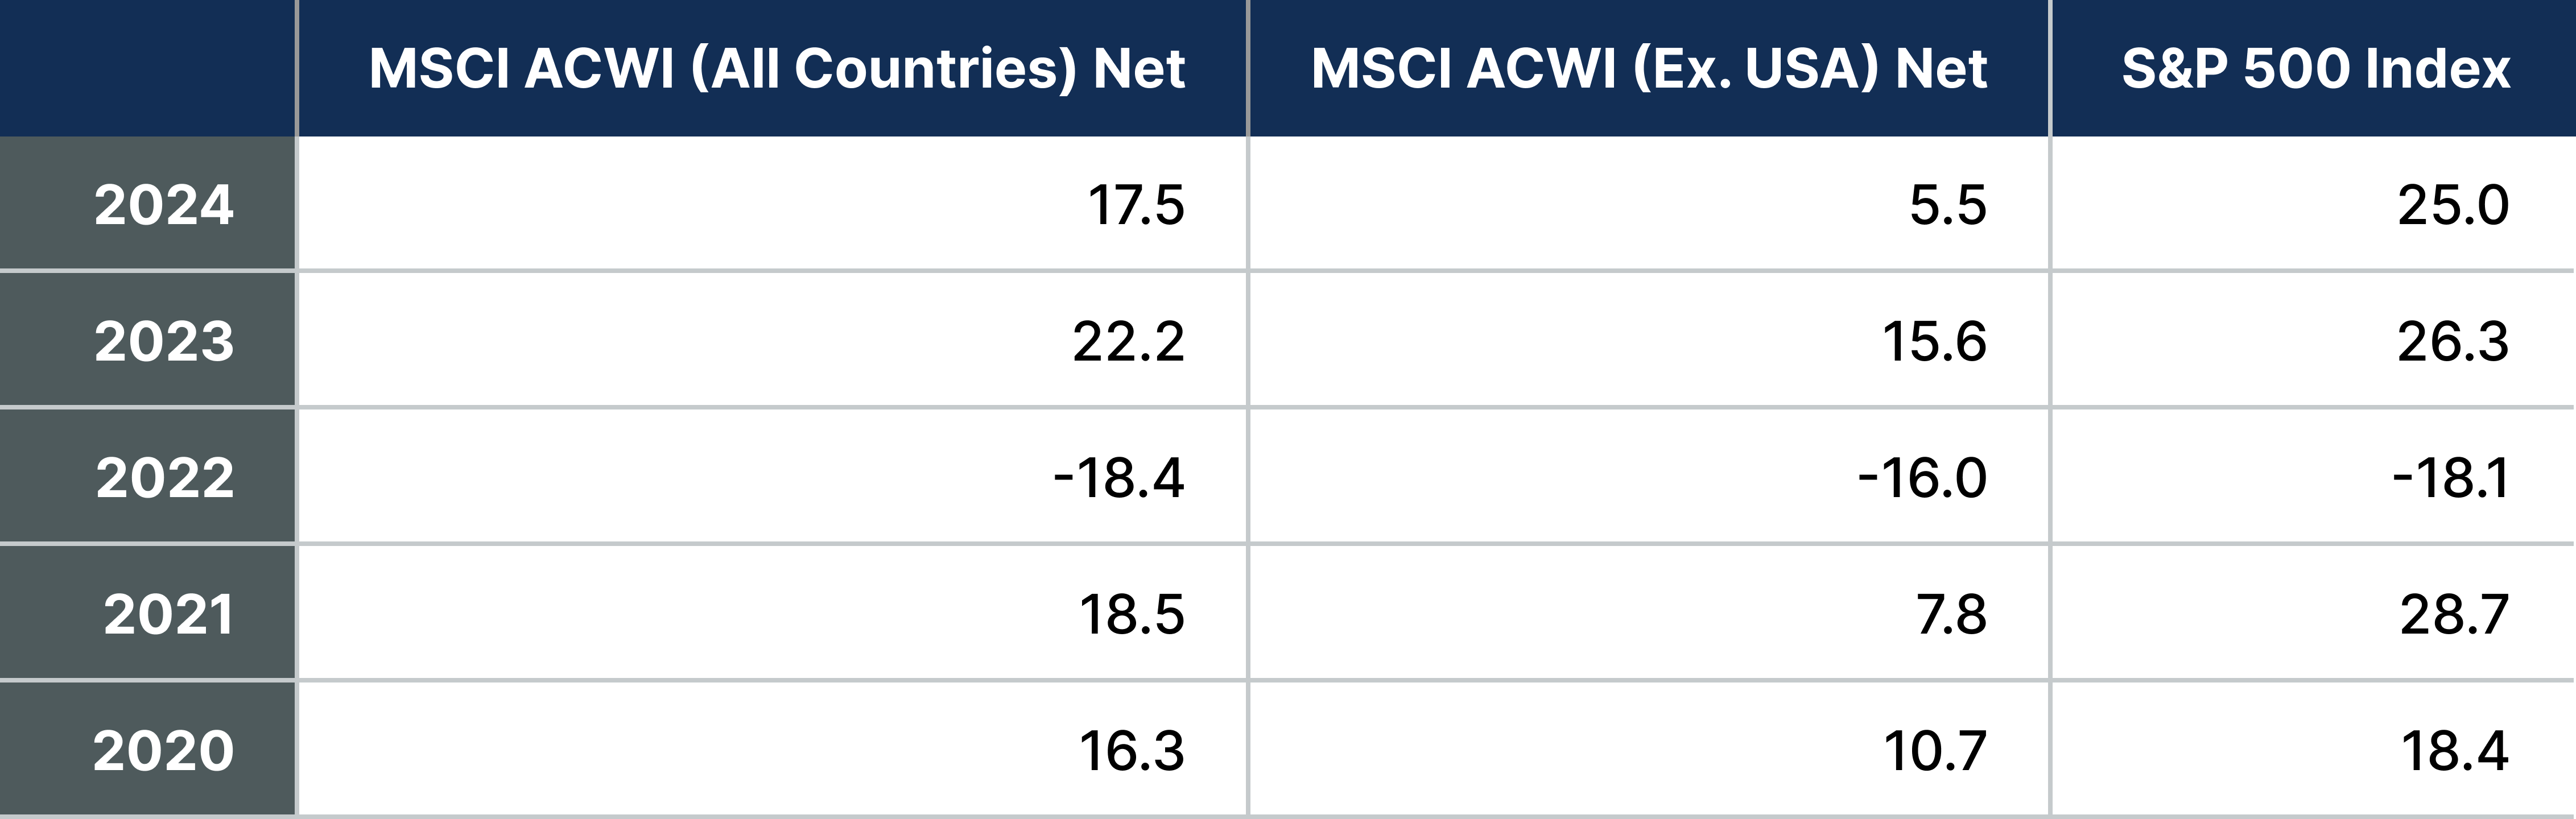
International stocks have had a banner start this year, with the MSCI All Country World Index (ACWI) ex-USA returning 18.1% in the first six months and handily outperforming the S&P 500 by nearly 12%, in USD terms. We believe the changing tide could be just the beginning of a shift in global equity leadership supported by cyclical and secular tailwinds as well as attractive valuations. Past performance is not an indication or guarantee of future results.

Key Takeaways

  • Higher rates and a more concentrated U.S. stock market create a potential opportunity for better diversification with value-oriented international equities.
  • We believe valuations remain generally attractive, while a fiscal shift also marks a turning point for the European region, with expanded infrastructure and defense spending acting as a catalyst for unlocking value and creating what we see as an attractive growth trajectory overseas.
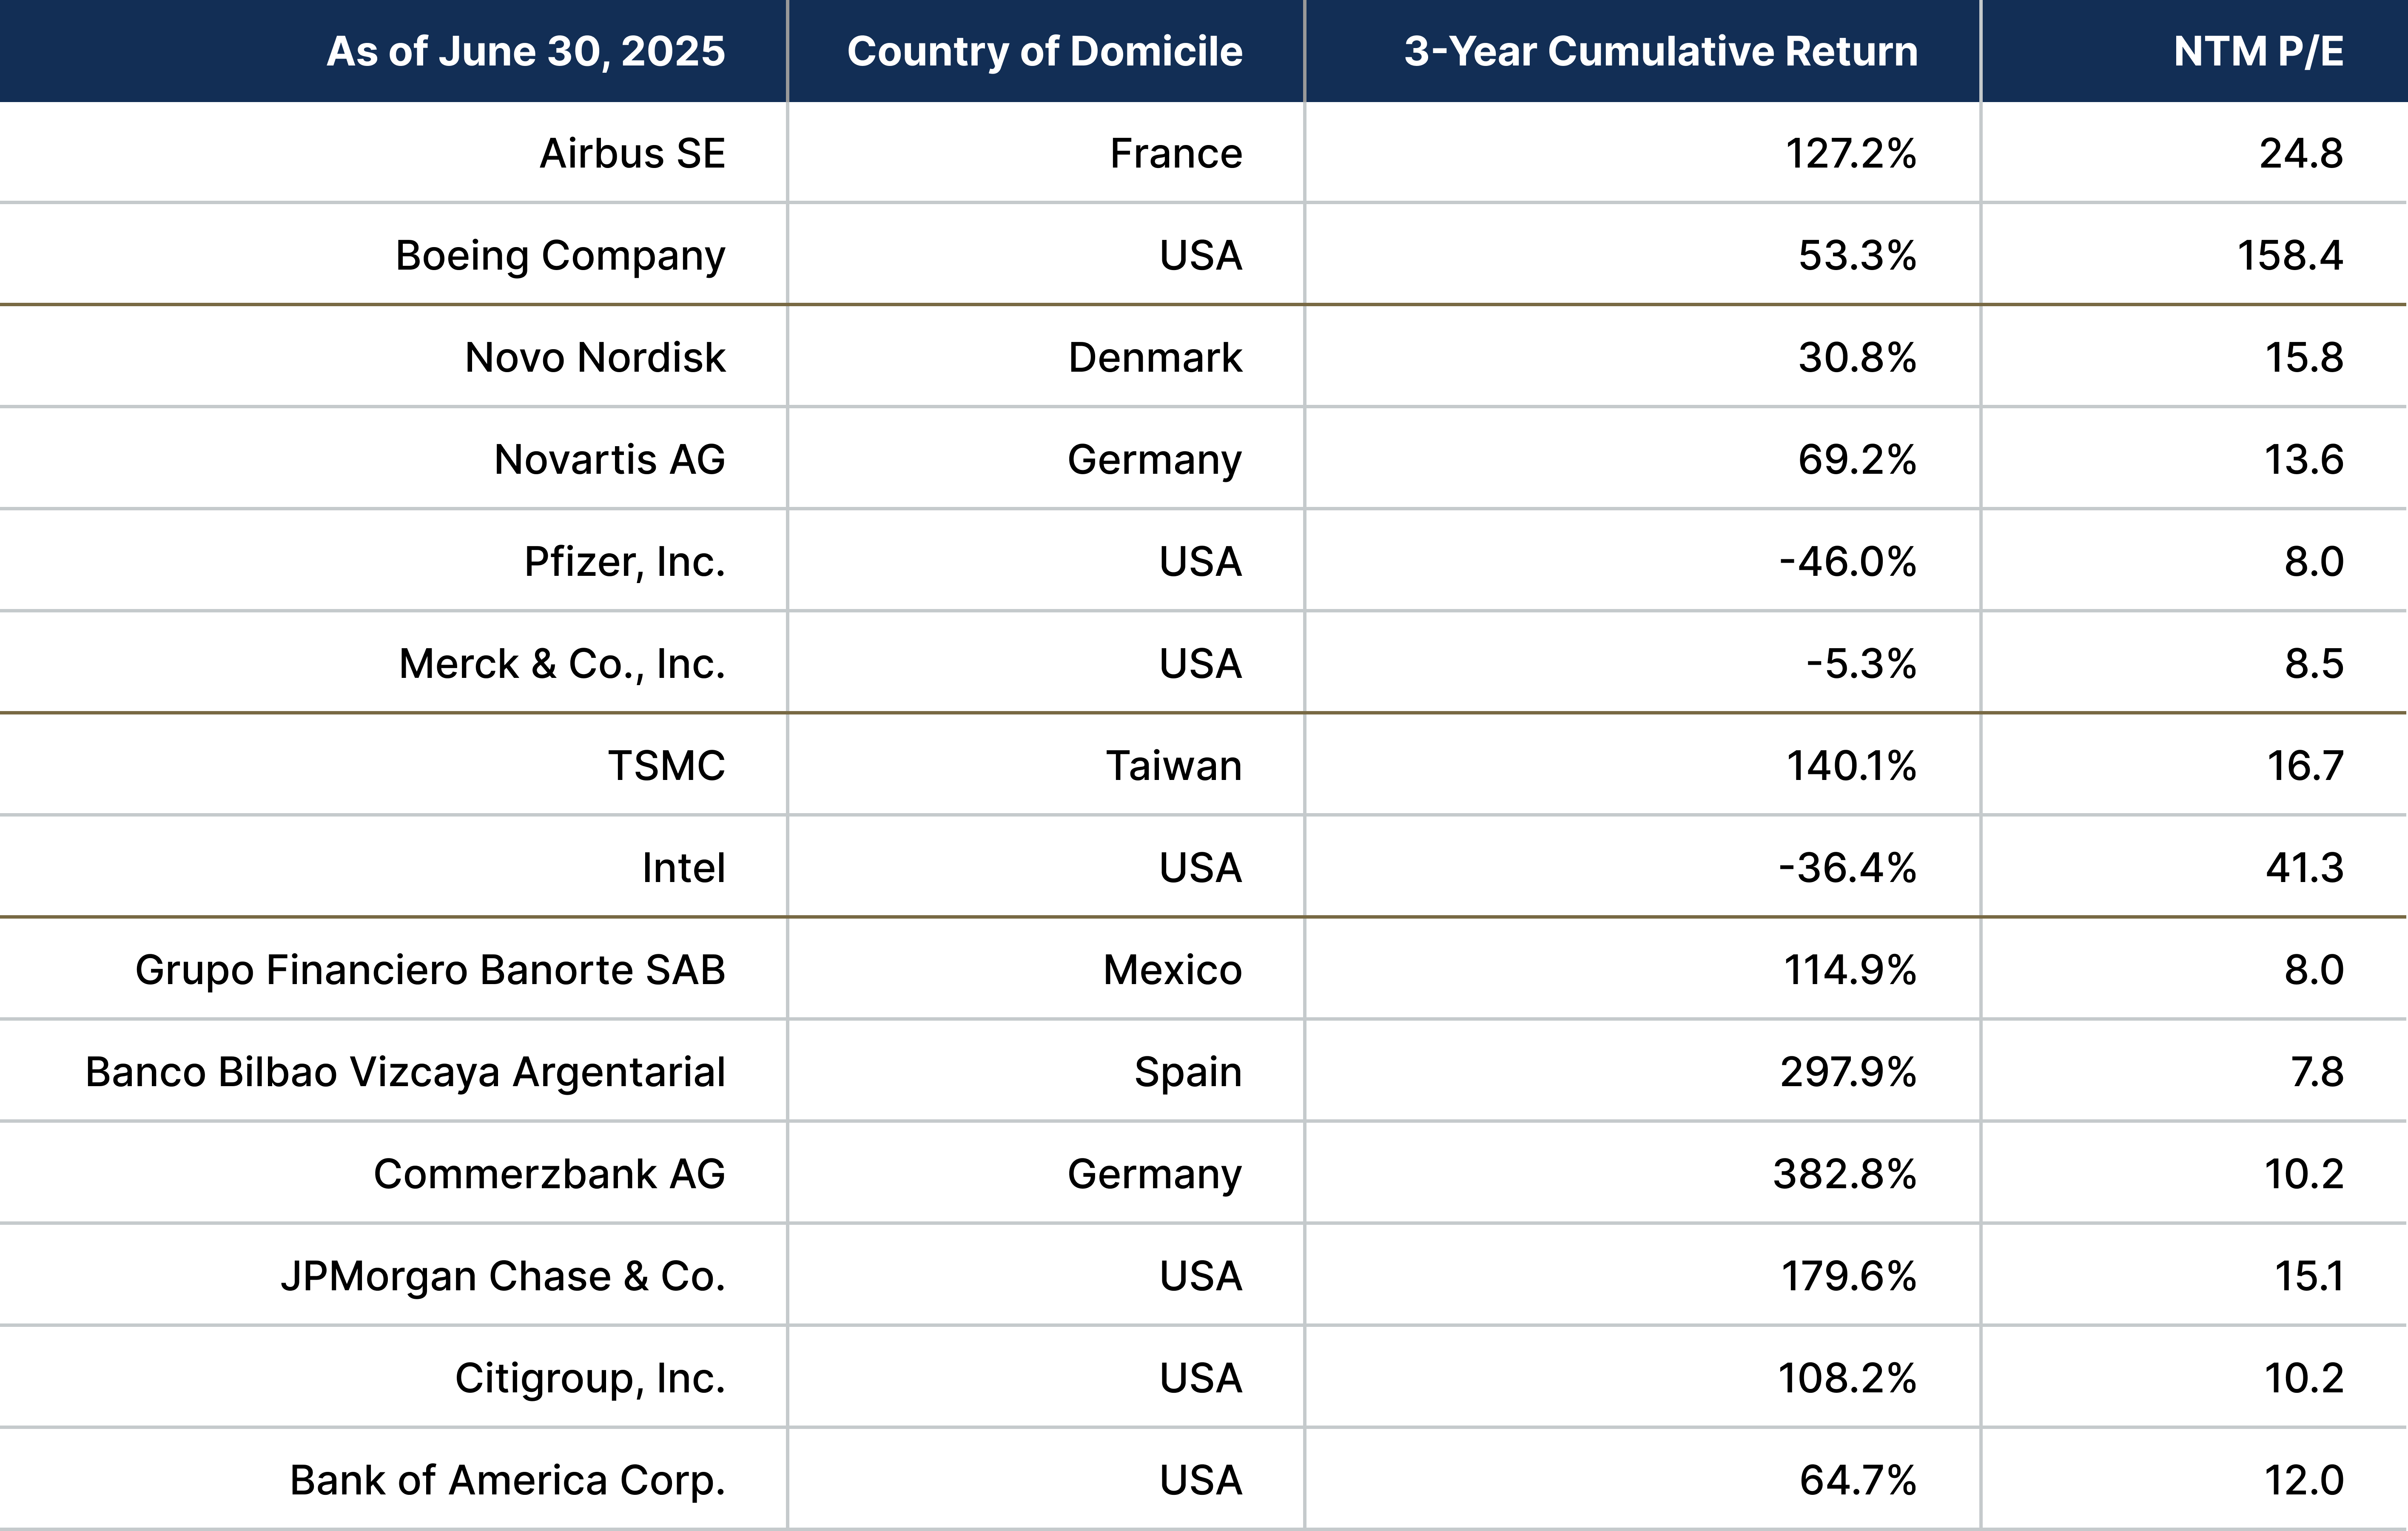
  • Many of the world’s top-performing, globally recognized companies are based outside the U.S. and are represented exclusively in international equity benchmark indexes. This underscores the value of an active, selective investment approach—one that seeks to identify quality metrics that have been historically linked to outperformance across the broad and diverse global equity landscape.

International equities underperformed U.S. equities over the better part of the last 15 years post- Global Financial Crisis (GFC)—a reminder that cycles of outperformance and valuation discount extremes can last a long time. While the global economy took a massive hit during the GFC, the U.S. bounced back faster than the rest of the world for several reasons, including a larger and quicker fiscal stimulus response, a stalled recovery in Europe due to its sovereign debt crisis, and high inflation coupled with a collapse in exports out of China. Add monetary stimulus into the mix with near-zero interest rates in the U.S., and there was a huge perceived opportunity to buy stronger U.S. risk assets, leading to a massive influx of both domestic and foreign investment.

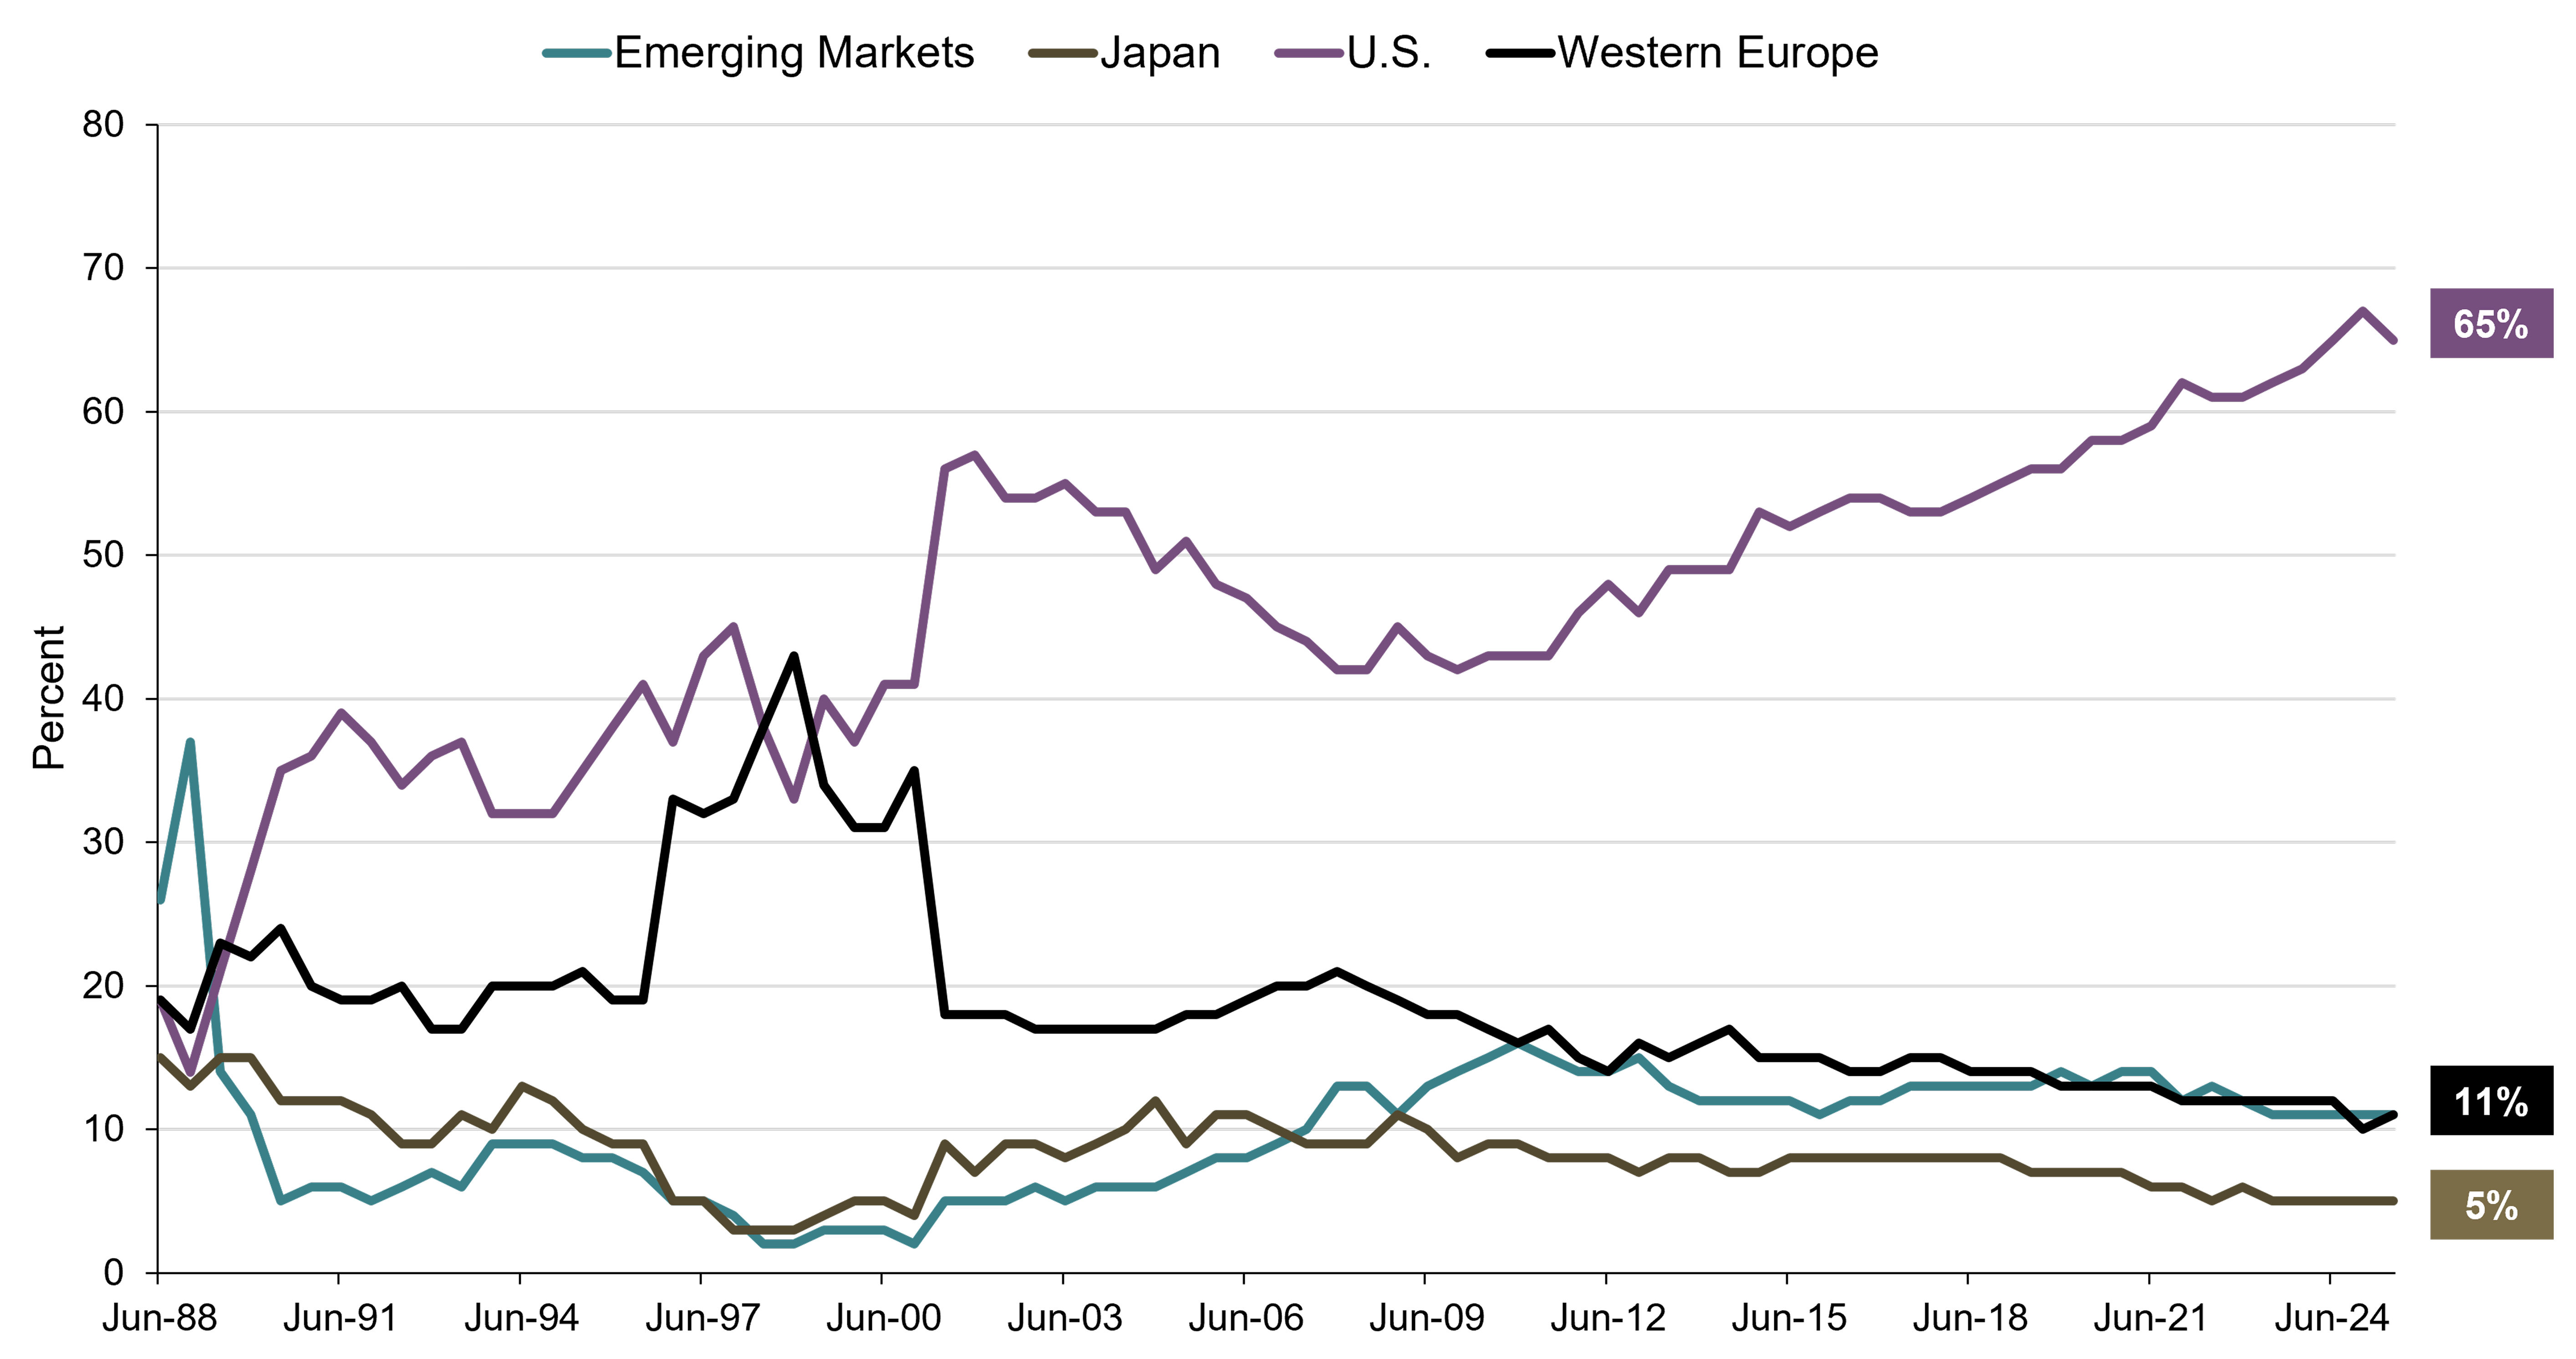
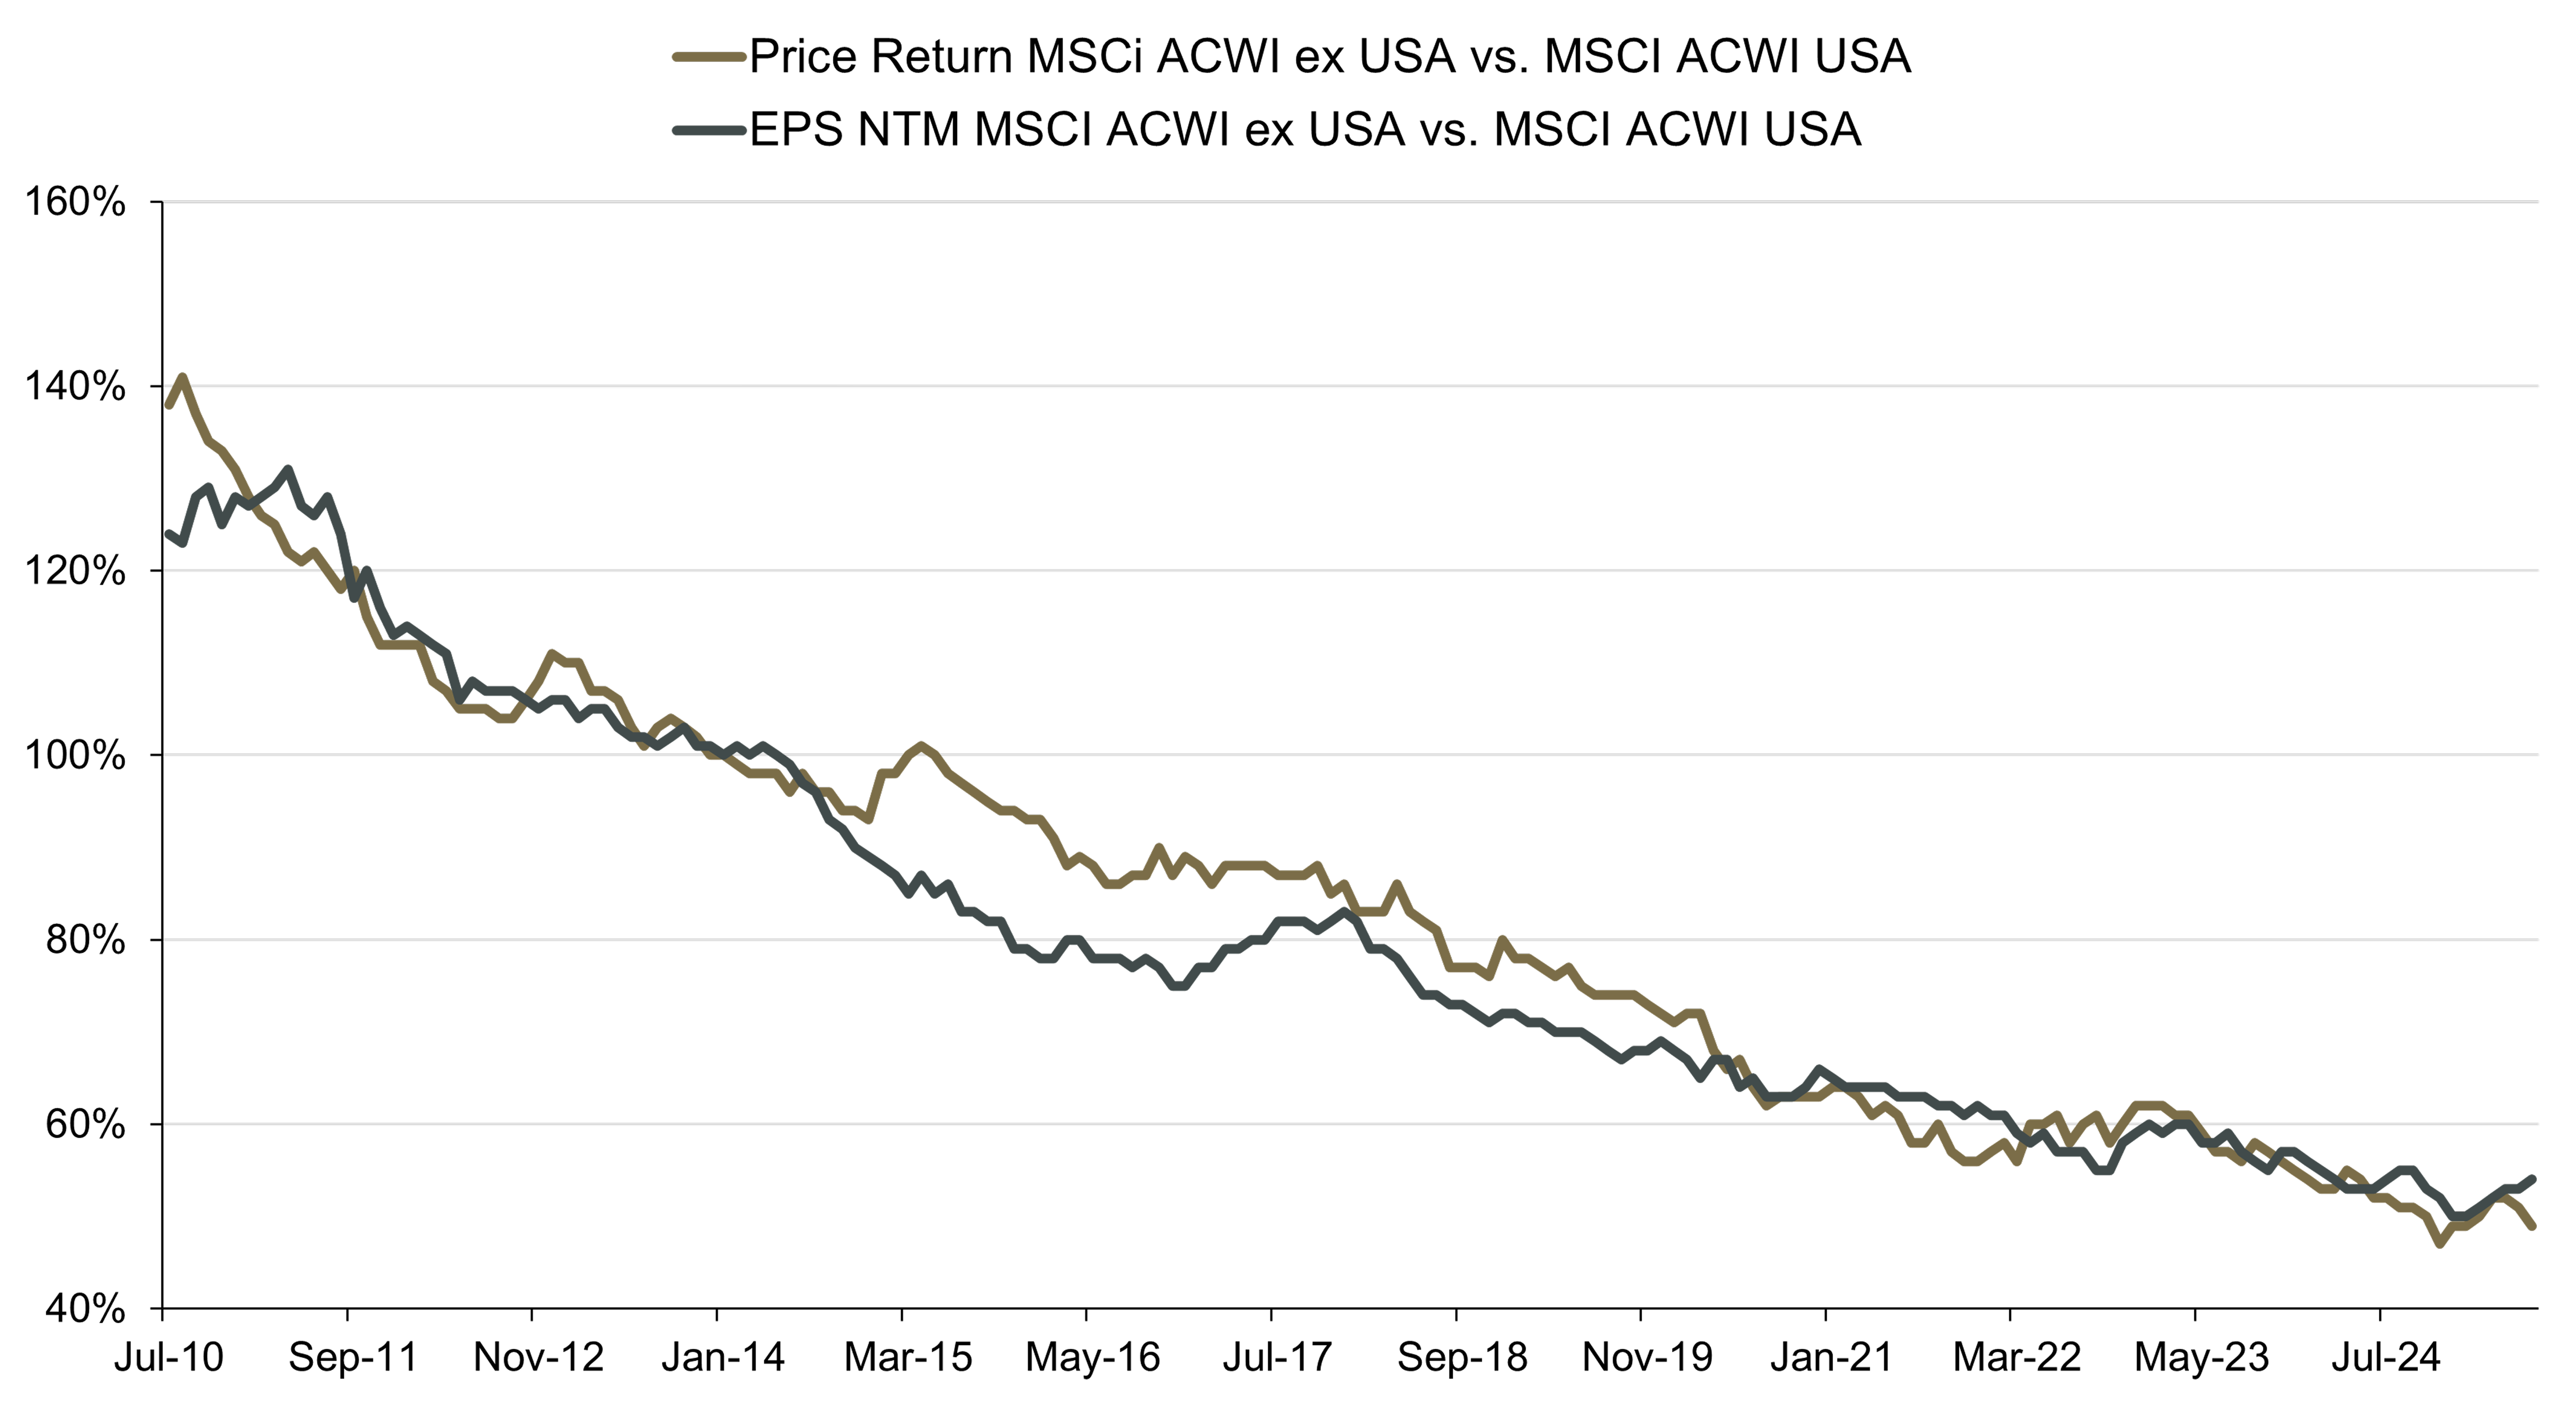
And yet, the extraordinary growth of U.S. equities from approximately 40% of the global equity market capitalization (cap) to 65% today (top panel Figure 1) proved not to be a bubble, but rather a reflection of superior fundamental profit growth (bottom panel Figure 1), driven largely by the technology sector.

Figure 1. U.S. Equity’s Share of Global Market Cap Soared Due to Healthy Profit Growth

Share of global market cap by category weight in the MSCI ACWI Index, December 31, 2002-June 30, 2025 (top panel), and MSCI ACWI ex USA price return as a proportion to MSCI ACWI USA price return and MSCI ACWI ex USA EPS NTM as a proportion to MSCI ACWI USA EPS NTM, July 31, 2010-June 30, 2025 (bottom panel)

Line Chart Showing U.S. Equity’s Share of Global Market Cap Soared Due to Healthy Profit Growth Share of global market cap by category weight in the MSCI ACWI Index, December 31, 2002-June 30, 2025
Line Chart Showing and MSCI ACWI ex USA price return as a proportion to MSCI ACWI USA price return and MSCI ACWI ex USA EPS NTM as a proportion to MSCI ACWI USA EPS NTM, July 31, 2010-June 30, 2025
Source: FactSet and MSCI. Data as of June 30, 2025. All Country World Index=ACWI. EPS NTM=earnings-per-share next twelve months. For illustrative purposes only and does not represent any specific portfolio managed by Lord Abbett or any particular investment. Indexes are unmanaged, do not reflect the deduction of fees and expenses, and are not available for direct investment. Due to market volatility, the asset classes depicted in this chart may not perform in a similar manner in the future. Past performance is not a reliable indicator or guarantee of future results.

Diversification Amid U.S. Market Concentration and New Rate Regime

The sustained outperformance of U.S. mega-cap technology (tech) stocks has helped to drive the U.S. exceptionalism narrative for several years now, most recently boosted by strong growth expectations after the new administration and the continued excitement over generative artificial intelligence (AI). The result of this long cycle of exceptional performance has been a U.S. equity market that is highly concentrated in just a few names, and predominantly in one industry—technology.

Following a period of retracement by these same technology stocks, post-DeepSeek announcement in January, and then the volatility due to the proposed tariffs in April 2025, U.S. equity markets rebounded back to new highs as investors downplayed the latest tariff-related headlines (presuming deals and negotiations will be made) and the probability of a U.S. recession. Just three companies have driven the market action though, with NVIDIA, Meta, and Amazon accounting for 50% of the S&P 500’s gains through June 30, 2025. While the breadth of the U.S. equity market has improved recently, the correlation between the index and the tech sector has been very strong over the past 10 years. With the Magnificent 7 (MAG 7) making up 32% of the S&P500, we believe the need for diversification is greater and more apparent than it has ever been. Data source for this content is FactSet.

The opportunity to diversify goes beyond geography and sector. The zero-interest rate policy in much of the world post-GFC disproportionately benefited longer-duration growth equities. The growth-oriented U.S. equity market was the biggest beneficiary of this monetary policy regime, with the S&P 500 returning 14.7% annualized versus MSCI Europe's 8.3% annualized return from 2009-2019, as the European market is skewed toward value-oriented sectors like financials. Data source for this content is FactSet.

Fast forward to today's higher rate environment, and there is a new mix of winners across the global playing field. Over the past three years, European banks, a traditional value sector, outperformed the MAG 7, as shown in Figure 2. They have benefited from the European Central Bank (ECB) keeping rates higher for longer than expected (improving net interest margins), as well as from increased fiscal stimulus and other pro-growth measures across the Eurozone that have lifted growth expectations for the region.

Figure 2. Traditional Value Sectors, Like European Banks, Have Outperformed U.S. Mega-Cap Tech

Cumulative price return of MAG 7 and European bank sector, July 31, 2022-June 30, 2025

Line Chart Showing Cumulative price return of MAG 7 and European bank sector, July 31, 2022-June 30, 2025
Source: Bloomberg and MSCI. Data as of June 30, 2025. MAG 7 refers to a group of seven U.S. mega-cap technology stocks that have significantly influenced the U.S. stock market. These stocks include: NVIDIA, Meta Platforms, Tesla, Amazon, Alphabet, Apple, and Microsoft. For illustrative purposes only and does not represent any specific portfolio managed by Lord Abbett or any particular investment. Indexes are unmanaged, do not reflect the deduction of fees and expenses, and are not available for direct investment. Due to market volatility, the asset classes depicted in this chart may not perform in a similar manner in the future. Past performance is not a reliable indicator or guarantee of future results.

It is worth noting that even as rates remain higher in the U.S., growth has continued to outperform value over the last three years, while value outperformed growth in the rest of the world (Figure 3), showcasing an exciting opportunity for diversification in a balanced portfolio. 

Figure 3. Growth Sectors Outperformed in the U.S., but Value Has Led the Rest of the World Since the COVID-19 Pandemic

Ratio of MSCI ACWI ex USA value to growth price return and ratio of MSCI ACWI USA value to growth price return, December 31, 2002-June 30, 2025

Line Chart Showing Ratio of MSCI ACWI ex USA value to growth price return and ratio of MSCI ACWI USA value to growth price return
Source: Bloomberg and MSCI. Data as of June 30, 2025. For illustrative purposes only and does not represent any specific portfolio managed by Lord Abbett or any particular investment. Indexes are unmanaged, do not reflect the deduction of fees and expenses, and are not available for direct investment. Due to market volatility, the asset classes depicted in this chart may not perform in a similar manner in the future. Past performance is not a reliable indicator or guarantee of future results.

Catalysts Provide a Turning Point

The relative outperformance of the U.S. versus the rest of the world over the years has also led to valuations becoming more attractive for the latter. In fact, MSCI ACWI ex-USA valuations versus the S&P 500 are still near historic lows today, even after a strong start this year, sitting at a 36% discount on an NTM P/E basis, as shown in Figure 1. While identifying attractive relative value is important, history suggests that valuation alone might not be a sufficient driver of superior investment returns; a catalyst is often needed to unlock value.

Much like the extraordinary U.S. stimulus was the key to lasting performance after the GFC, we believe that the catalyst in the European region is finally here, after Germany announced expanded fiscal stimulus measures with a $546 billion infrastructure fund and pledged another $500 billion to increase defense spending. This $1 trillion plan provides a tailwind to companies with defense spending exposure, as well as to the industrials and materials sectors, renewable energy firms, and European banks. For context, this combined spending is more than 3x what Germany allocated for its entire post-pandemic stimulus package. Moreover, other European countries have echoed Germany’s commitment to defense spending, including at least seven other European Union (EU) member states. This marks a generational shift in Europe’s commitment to fiscal austerity and dependence on monetary policy to stimulate the economy. As balanced budgets, debt reductions, and limited government stimulus are deprioritized, this could be a turning point for Europe’s economic trajectory.

Rethinking Market Leadership Outside the U.S.

Beyond geographies, sectors, and factors, we are fundamentally a team of stock pickers. When we examine companies in more detail, we found that many of the dominant businesses and equity market winners over the last three years were domiciled around the world. While many of these companies are recognizable to the U.S. investor, they are not accessible through domestic indexes.

Over the last 15 years, on average, 75% of the top-fifty best-performing stocks in the MSCI ACWI were outside the U.S. Through June 30, 2025, that count stands at 92%, according to FactSet. The U.S. clearly has strong technology companies, especially in areas like software, in our view. For example, we believe there is no competitive non-U.S. version of NVIDIA. But the technology sector makes up only 8% of the MSCI EAFE Index (Europe, Australasia, and Far East). In some areas, strong businesses overseas can compete with, and often outperform, their U.S. counterparts. Examples include Airbus versus Boeing, Taiwan Semiconductor Manufacturing Company Limited (TSMC) versus Intel, and Novartis versus Pfizer. In many cases, the domestic option may also be more expensive on a forward earnings basis (see Figure 4). In other sectors like luxury goods, spirits, fragrances, and certain industrial markets such as vacuums and compressors, non-U.S. companies have often led the competition. It all boils down to expanding to the broadest opportunity set to find dominant businesses around the world.

Figure 4. How Do Quality Companies Outside of the U.S. Compare?

Three-year cumulative returns and NTM P/E of companies in select sectors and countries

Chart Showing Three-year cumulative returns and NTM P/E of companies in select sectors and countries
Source: FactSet and MSCI. Data as of June 30, 2025. For illustrative purposes only and does not represent any specific portfolio managed by Lord Abbett or any particular investment. Indexes are unmanaged, do not reflect the deduction of fees and expenses, and are not available for direct investment. Due to market volatility, the stocks depicted in this chart may not perform in a similar manner in the future. Past performance is not a reliable indicator or guarantee of future results.

Quality Over Quantity: The Case for Selectivity in Global Equity Investing

As we have observed, both cyclical and long-term factors can make a compelling case for global equities. But what is the most effective way to invest in this asset class? While index investing is a common approach in U.S. equity markets, it may not be the best fit for international markets. Given the vast array of options, “owning the entire market” in a broader geographic universe can also mean holding companies with weak fundamentals, such as low returns on invested capital, negative earnings, poor or stagnant earnings growth, and high debt levels.

Therefore, we advocate a more selective approach to global equity investing, one that seeks to identify businesses with sustainable competitive advantages. These strengths can enable firms to demonstrate robust quality indicators, including high returns on invested capital (ROIC), free cash flow, and healthy margins—traits that are characteristic of companies with a strong competitive “moat.” In fact, we have found that over the last decade, the top quintile (top 20%) segment of the MSCI ACWI ex-USA Index, based on annual ROIC growth, outperformed the rest of the index by 59% (see Figure 5). 

Figure 5. Quality Stocks with High ROIC Have Outperformed

MSCI ASWI ex USA top 20% ROIC segment cumulative return and the rest of the index, July 31, 2015-June 30, 2025

Line Chart showing MSCI ASWI ex USA top 20% ROIC segment cumulative return and the rest of the index, July 31, 2015-June 30, 2025
Source: Bloomberg and MSCI. Data as of June 30, 2025. For illustrative purposes only and does not represent any specific portfolio managed by Lord Abbett or any particular investment. Indexes are unmanaged, do not reflect the deduction of fees and expenses, and are not available for direct investment. Due to market volatility, the asset classes depicted in this chart may not perform in a similar manner in the future. Past performance is not a reliable indicator or guarantee of future results.

Summing Up

International equities offer a compelling diversification opportunity—particularly in value-oriented sectors. A fiscal shift in the European region may serve as a catalyst for growth in many sectors, such as industrials and materials, as well as renewable energy companies. At the same time, many of the world’s top-performing and most recognizable companies are based outside the U.S. and only accessible through international indexes. With such a broad and diverse universe, we believe that a selective, quality-focused approach to navigating international markets can identify companies with competitive strengths, while active management teams with deep and broad research and security valuation capabilities may be particularly well positioned to capitalize on the trends that could drive future growth across global equity markets.

Past Performance of Selected Indices (Calendar Year):

Performance Chart

NOTE: Past performance is no indication or guarantee of future results.

Source: MSCI and Bloomberg. Returns shown are expressed in percent. Return data is based on U.S. dollar-denominated index data. Performance of the indices may be affected by changes in the exchange rates between the currency denomination of the indices and any non-U.S. dollar denomination. The MSCI ACWI and the MSCI ACWI Ex-USA. indices are shown with net dividends, which approximates the minimum possible dividend reinvestment. The dividend is reinvested after deduction of withholding tax, applying the rate to non-resident individuals who do not benefit from double taxation treaties. MSCI uses withholding tax rates applicable to Luxembourg holding companies, as Luxembourg applies the highest rates. None of the performance in this table is meant to represent any Lord Abbett products or services.