As a result of the magnitude of prior drawdowns, investors have exhibited a tendency to avoid these stocks, leading to higher excess returns. Ruenzi and Weigert provide evidence of this phenomenon in a 2017 study showing high tail-risk stocks meaningfully outperform.6 The “fat tail” of momentum returns may inhibit leveraged investors from exploiting the momentum anomaly, a capital restriction that may contribute to the phenomenon’s persistence.
Types of Momentum
Cross-Sectional Momentum
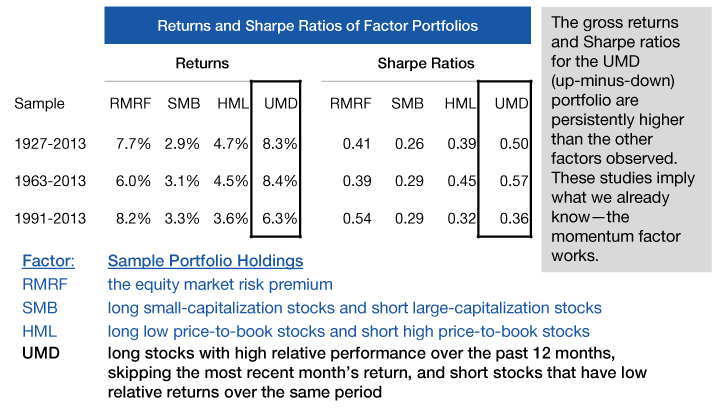
Cross-sectional momentum is what the well-established, quantitative momentum factor is based on, and what most investors identify when they seek to incorporate pure momentum exposure. We would argue that this measure of momentum is directionally powerful and can be a useful tool, particularly in bear markets when one needs to determine which stocks are performing best (i.e., relative strength) versus peers.
However, we would also note some shortcomings in practice that require attention. First among these is the common implementation of cross-sectional momentum, which leverages the “12-1” construction methodology. The determination of the “12-1” portfolio is predicated on performance over the last 12 months, excluding the most recent month to eliminate a reversal effect over that time period—hence, 12 minus 1 or “12-1”. This approach fits the past return data well but lacks some intuitive appeal. We would argue that the most recent month likely contains relevant and informative data about potential changes in direction for one stock, an industry, or the whole market, and that the exclusion of that month may lead to an inability to respond to new and meaningful information in a timely fashion.
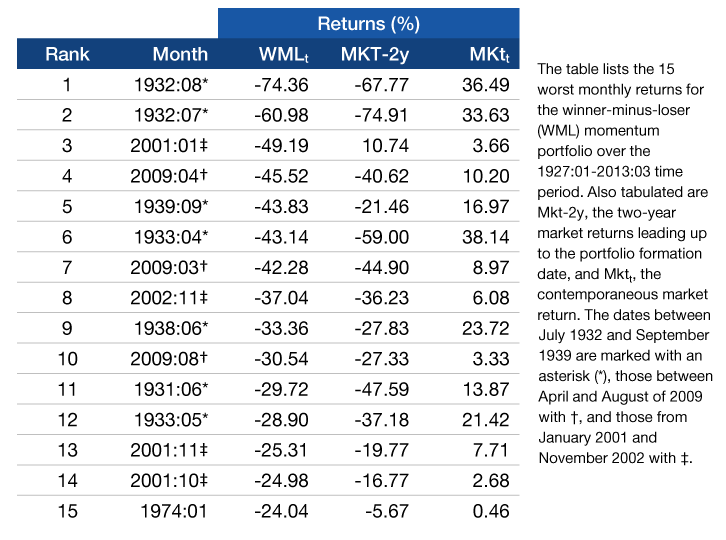
Another shortcoming is the tendency for the momentum factor to crash following extended trends and manias, and it is one of the key reasons why, as noted above, one could argue the momentum factor has not been arbitraged away. Crashes are difficult to avoid, when following a pure price momentum strategy based on cross-sectional momentum, because of the lag effects in trading rules compared to the potential for a sharp correction down in stock prices during liquidity events and other market shocks. Notably, some newly developed ETFs (exchange traded funds) have sought to capture this factor, but liquidity limitations and imprecise rebalancing frequency, which is generally infrequent and lagging, make the actual date and time of rebalance a significant variable and source of volatility. Additionally, according to Jegadeesh and Titman (2001), much of the cross-sectional momentum factor return is generated in the first few months after portfolio formulation, an event that is typically frequent in academic studies and suggests real-life lagged portfolio formation would forfeit some of this factor’s return.7
Time-Series Momentum
Much less known is time-series momentum, otherwise known as absolute momentum or trend following, which is generally an assessment of a security’s performance against its own history. This kind of trend following has fans among practitioners but is less well documented in empirical finance, partly due to a lack of standardization in implementation and data limitations.
Technical analysis has historically been derided by academics as not being evidence based or well motivated from a behavioral perspective, but that is beginning to change. A groundbreaking study published in the Journal of Financial Economics, “Time Series Momentum” (Moskowitz, Ooi and Pedersen, 2012) documents the strong correlation of future returns with past returns in dozens of futures and forwards, including broad country equity indices, currencies, commodities, and sovereign bonds over 25 years.8 They found the findings to be robust across a number of sub-samples, look-back periods and holding periods. The 12-month time series momentum returns were positive for every asset contract examined.
From an intuitive perspective, time-series momentum strategies may allow investors to make more real-time assessments of changes that are observable but not fully incorporated into the current price of a security. We have found that time-series momentum works most effectively through comparisons via moving averages and categorizing stocks into distinct phases of their lifecycle that enable rational buy-and-sell decisions based on stock price trends and reversals.
The one piece of the puzzle still missing from all of this that can help bring further strength to an investment strategy seeking exposure to momentum is “why”—why are stock prices behaving a certain way? What is ultimately driving stock prices in the short, intermediate, and long term? Which brings us to fundamental, or operating, momentum.
Operating Momentum
While price momentum can likely be attributed to the readily observable manifestation of anchoring, fundamental changes in a business, such as customer adoption or new product rollouts, can lead to meaningful changes in the intrinsic value of the stock. These underlying operating changes may present themselves in different metrics— whether they are accelerating revenue or earnings growth. And while the applicability of these metrics may vary by industry, these fundamental changes are generally observable to an analyst who is closely monitoring the stock, and those changes may precede or be concurrent with the price movement that gives the analyst a buy signal.
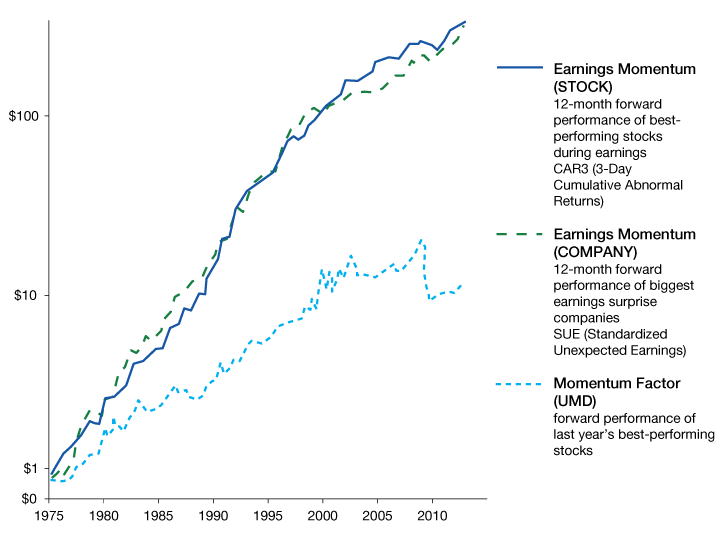
Here again, data limitations have inhibited adoption by the academic community, but that is starting to change. Chan, Jegadeesh, and Lakonishok demonstrated the efficacy of operating momentum as early as 1996 in “Momentum Strategies”.9 Another important study on the operating momentum concept came from Robert Novy-Marx in 2014, titled “Fundamentally, Momentum is Fundamental Momentum”. Novy-Marx found that fundamental momentum measured through earnings surprises explained a large portion of cross-sectional price momentum’s anomalous returns.10
A chart from Novy-Marx’s study is shown in Exhibit 3. UMD (“up minus down”) represents cross-sectional price momentum returns from a portfolio consisting of holding the last 12-month winners (minus biggest losers), excluding the most recent month (12-1), and shorting the last 12-month losers, excluding the most recent month.