2026 Midyear Investment Outlook: An Active Environment for Fixed Income

Resilient economic growth, elevated carry, and widening dispersion across credit markets help to create opportunities for active fixed income investing in the second half of 2026.

This is a marketing communication.

Dispersion Emerges as the Defining Theme for the Second Half of 2026

Midway through 2026, the U.S. economy remains on solid ground. While markets have absorbed geopolitical shocks and ongoing uncertainty about the impact of AI and higher oil and gas prices feeding inflationary impulses, the underlying economic backdrop remains relatively steady.

U.S. nominal gross domestic product (GDP) growth remained strong at 6% year over year in the first quarter, despite quarter-to-quarter fluctuations tied to government shutdowns. Since the end of 2025, consumer spending has remained healthy, with retail sales increasing 4.9% year over year, while the unemployment rate declined to 4.3%.

Against this supportive macroeconomic backdrop, dispersion has become the defining market theme for the second half of 2026. Normalized interest rates, AI disruption fears, geopolitical and inflation uncertainty, and shifting sector leadership have widened the gap between companies that can adapt and potentially benefit from this new regime and more vulnerable issuers that may struggle to adjust to a more demanding operating environment. Higher financing costs are reinforcing this trend, driving greater differentiation across sectors and issuers, even as higher nominal growth continues to support carry and many cyclical areas of the market. As dispersion widens, markets have become more focused on distinguishing between issuers positioned to benefit from the current environment and those more vulnerable to higher financing costs, AI disruption, or weaker operating trends.

In turn, this dispersion elevates the role of active management, where rigorous fundamental research and careful security selection are critical to seeking issuers best positioned to navigate these shifts and potentially capture differentiated sources of portfolio alpha.

Selective Positioning for AI CapEx and Elevated Carry

AI-related investments are one of the clearest examples of this dispersion and remain a key theme across both investment grade and leveraged credit markets. In high quality portfolios, the focus is on sectors that can either potentially benefit from the capital spending tied to the AI buildout or are at lower risk of disruption. These include energy, utilities, gencos (power generation companies), industrials, data centers, aerospace, and money center banks. In leveraged credit, positioning is similarly tied to the AI-driven capital expenditure (CapEx) cycle, including copper, aluminum, power infrastructure, and select AI-related issuers that continue to grow within both the investment grade and high yield markets. We avoid seeking out areas more exposed to AI-driven disruption, including certain technology and software issues.

The broader capital spending cycle has helped support earnings growth and corporate fundamentals across many cyclical and capital-intensive sectors. In our view, that remains constructive for credit, but it also requires careful issuer selection as AI disruption, higher financing costs, and shifting sector leadership continue to create potential winners and losers. We also remain cautious on consumer-related cyclicals due to elevated price pressures.

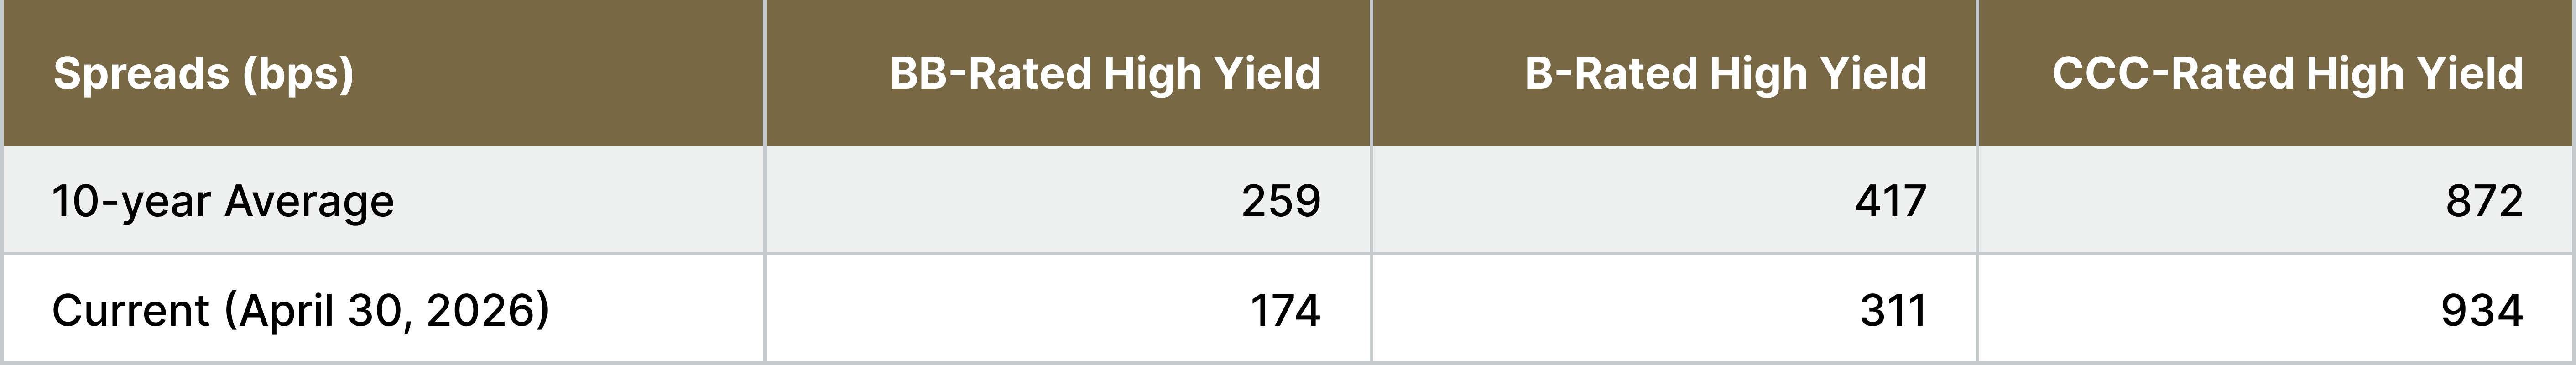
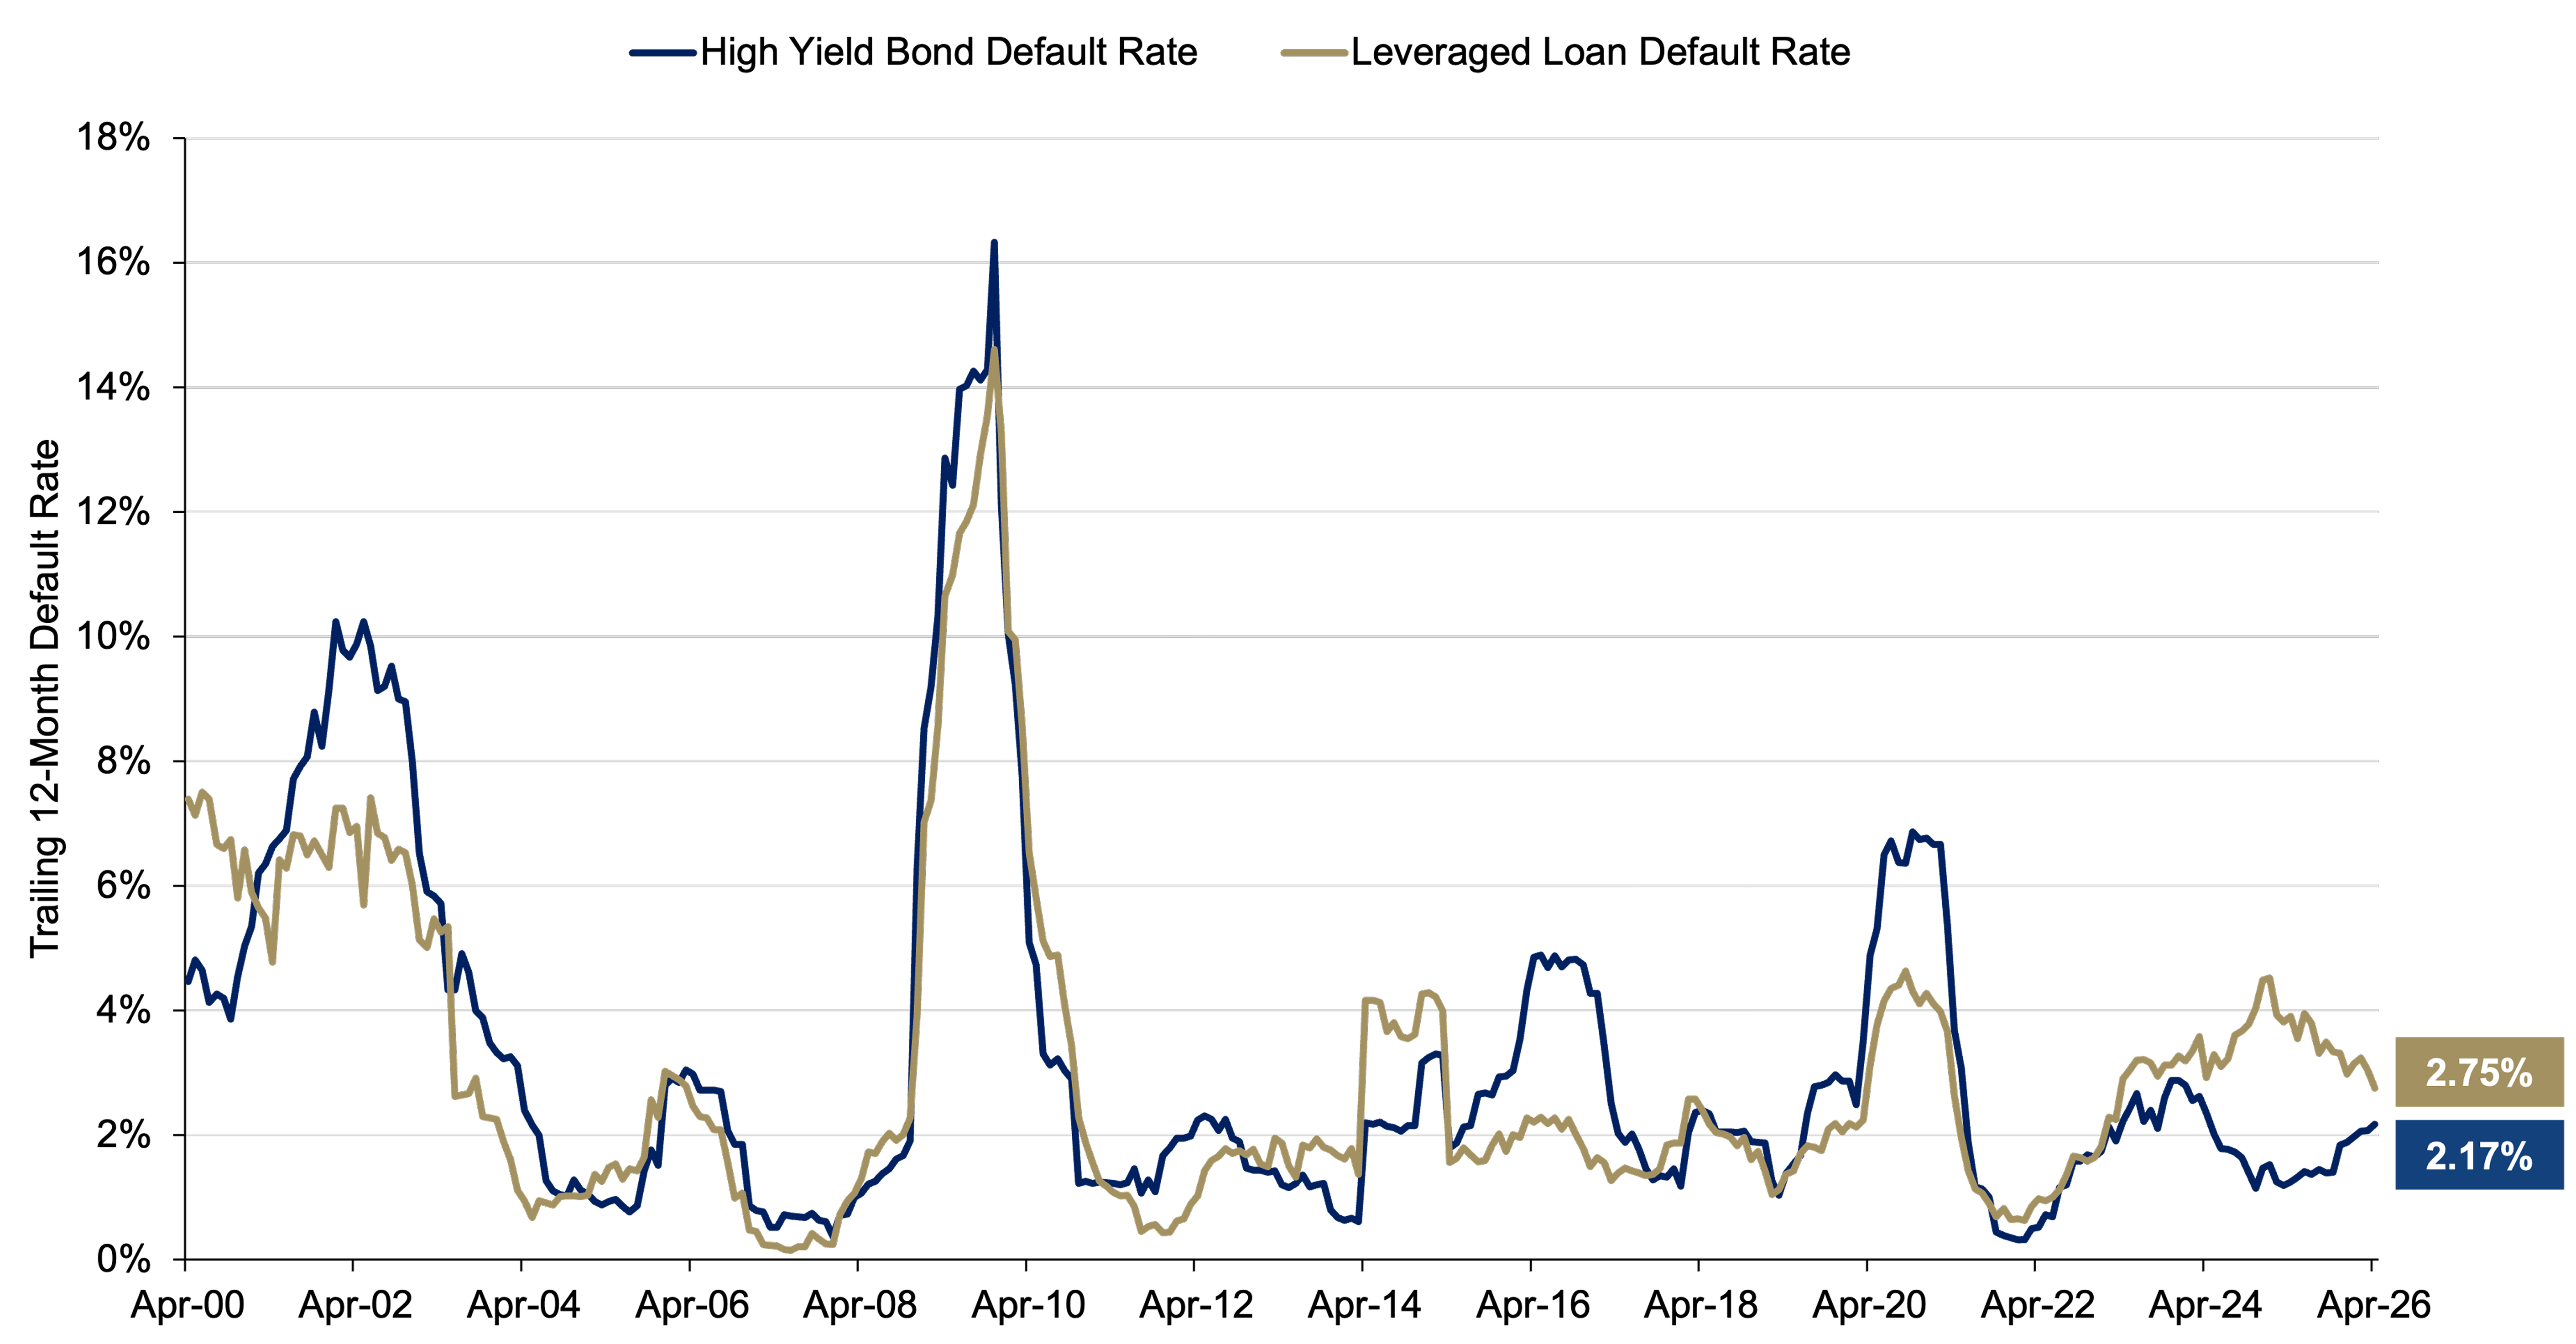
In leveraged credit, carry remains attractive while spreads remain near historically tight levels, which limits the case for broad beta exposure. Defaults across high yield bonds and leveraged loans remain relatively low by historical standards, and we continue to closely monitor refinancing needs and the impact of higher rates across more leveraged issuers.

Figure 1. Spreads Remain Tight While Defaults Close to Historical Lows

ICE BofA U.S. High Yield Index spreads by credit rating, (top panel), high yield bond and leveraged loan trailing-12-month default rate, April 30, 2000—April 30, 2026 (bottom panel)

Table of high yield bond spreads shows current spreads (April 30, 2026) below 10-year averages for BB-rated (174 vs. 259 bps) and B-rated bonds (311 vs. 417 bps), but higher for CCC-rated bonds (934 vs. 872 bps).
Line chart comparing trailing 12‑month default rates shows high yield bonds and leveraged loans peaking during downturns (notably around 2009) and stabilizing by 2026 at approximately 2.17% and 2.75%, respectively.
Source: Bloomberg and J.P. Morgan. Data as of April 30, 2026. BB-rated high yield represented by the ICE BofA U.S. BB High Yield Constrained Index. B-rated high yield represented by the ICE BofA U.S. B High Yield Constrained Index. CCC-rated high yield represented by the ICE BofA U.S. CCC & Lower High Yield Constrained Index. OAS=option-adjusted spread, which is the spread that a bond or credit instrument offers over a risk-free benchmark curve (typically Treasuries), after adjusting for the value of any embedded options. Default rates include distressed exchanges. The high yield bond and leveraged loan market may not perform in a similar manner under similar conditions in the future. The historical data shown in the chart above are for illustrative purposes only and do not represent any specific portfolio managed by Lord Abbett or any particular investment. Indexes are unmanaged, do not reflect the deduction of fees or expenses, and are not available for direct investment. Past performance is not a reliable indicator or guarantee of future results.

Duration management has also remained a primary focus. Positioning has continued to emphasize shorter-duration, higher-carry opportunities, particularly on the front end of the yield curve where income levels remain attractive relative to spread risk, and short credit offers attractive relative value compared to longer-duration credit in core and short-duration strategies. This approach also reflects an emphasis on staying “closer” to home in terms of credit risk and duration, given the geopolitical tail risks of the Iran conflict. Areas including short-duration high yield, floating-rate credit, collateralized loan obligations (CLO), commercial real estate (CRE) CLOs, and select asset-backed securities (ABS) sectors continue to offer attractive carry opportunities in leveraged credit portfolios without requiring significant duration exposure, in our view. Within high-quality strategies, credit allocations have been focused on ABS, investment-grade and high yield corporate bonds, and non-agency residential mortgage-backed securities (RMBS).

Within high yield strategies, exposure to lower-quality CCC-rated credit has been reduced as tighter spreads leave less room for error in a higher-rate environment. Higher financing costs and refinancing risk remain more challenging for weaker issuers, reinforcing the importance of selectivity, as dispersion across leveraged credit markets continues to widen.

What We’re Watching in the Second Half of 2026

Looking ahead, the key questions for fixed income markets center on inflation, interest rates, and whether financial conditions remain supportive. The economy has remained resilient, but higher energy prices, elevated geopolitical uncertainty, and the potential for higher financing costs could create additional volatility across both investment-grade and leveraged credit markets, particularly if the Iran conflict persists, as prolonged disruption could increase the likelihood and magnitude of tail risks.

At the same time, ongoing AI-related infrastructure spending, fiscal support, and solid corporate fundamentals continue to provide support. In our view, the combination of elevated carry, relatively stable growth, and widening dispersion continues to create a constructive backdrop for active fixed income management, disciplined security selection, and a focus on companies and sectors with resilient business models, healthy balance sheets, and the ability to navigate a higher-rate environment.